Command Digital Asset Data from One API Suite

  • Robust — stress-tested at institutional scale
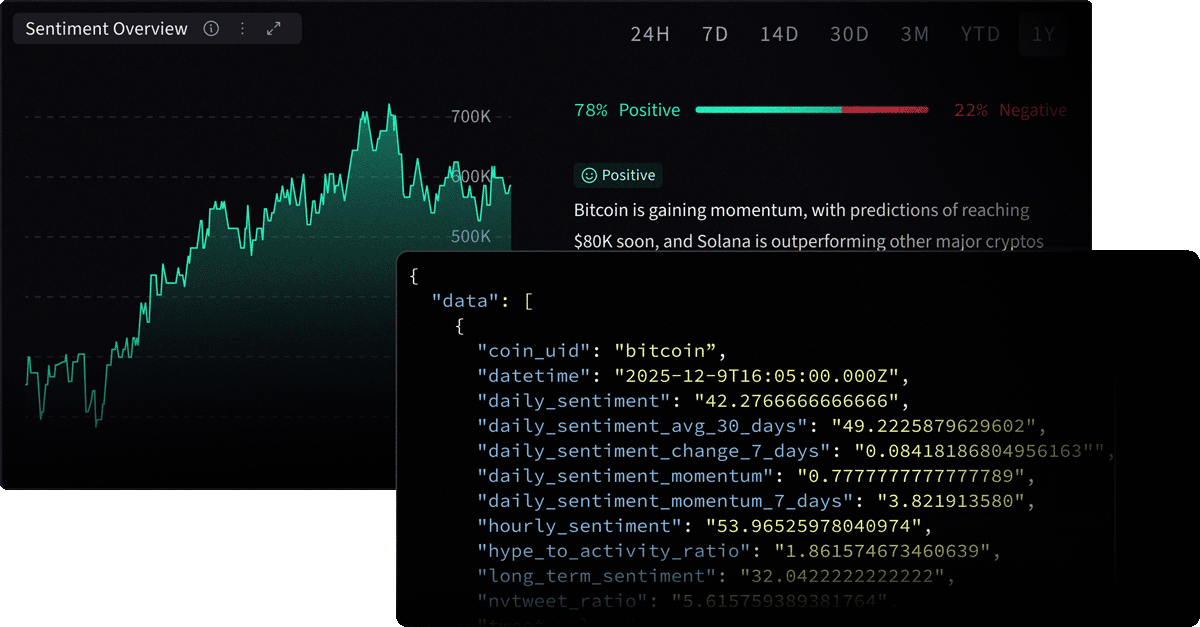
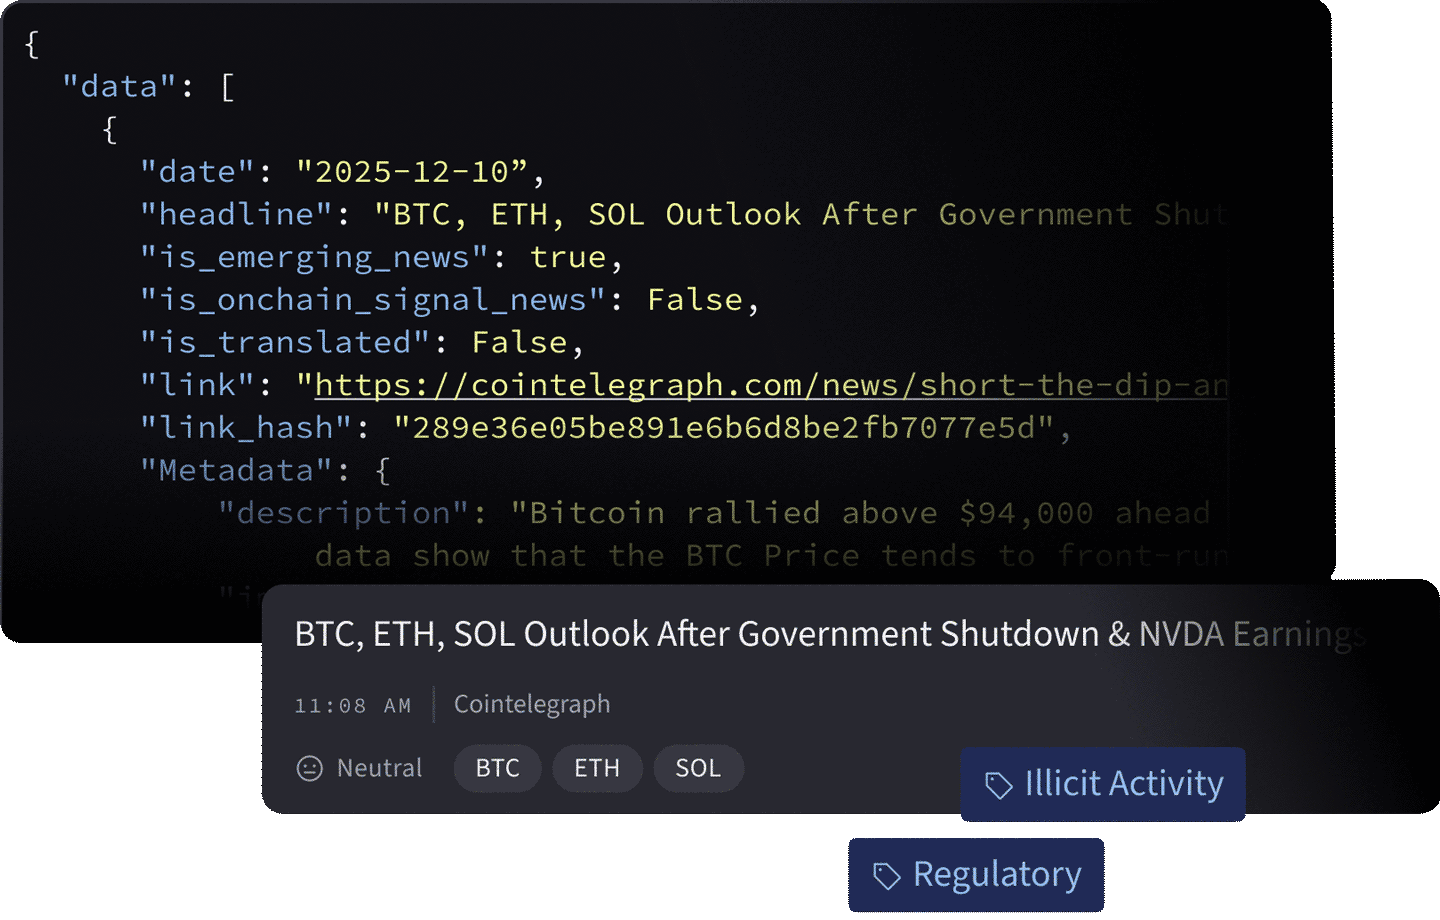
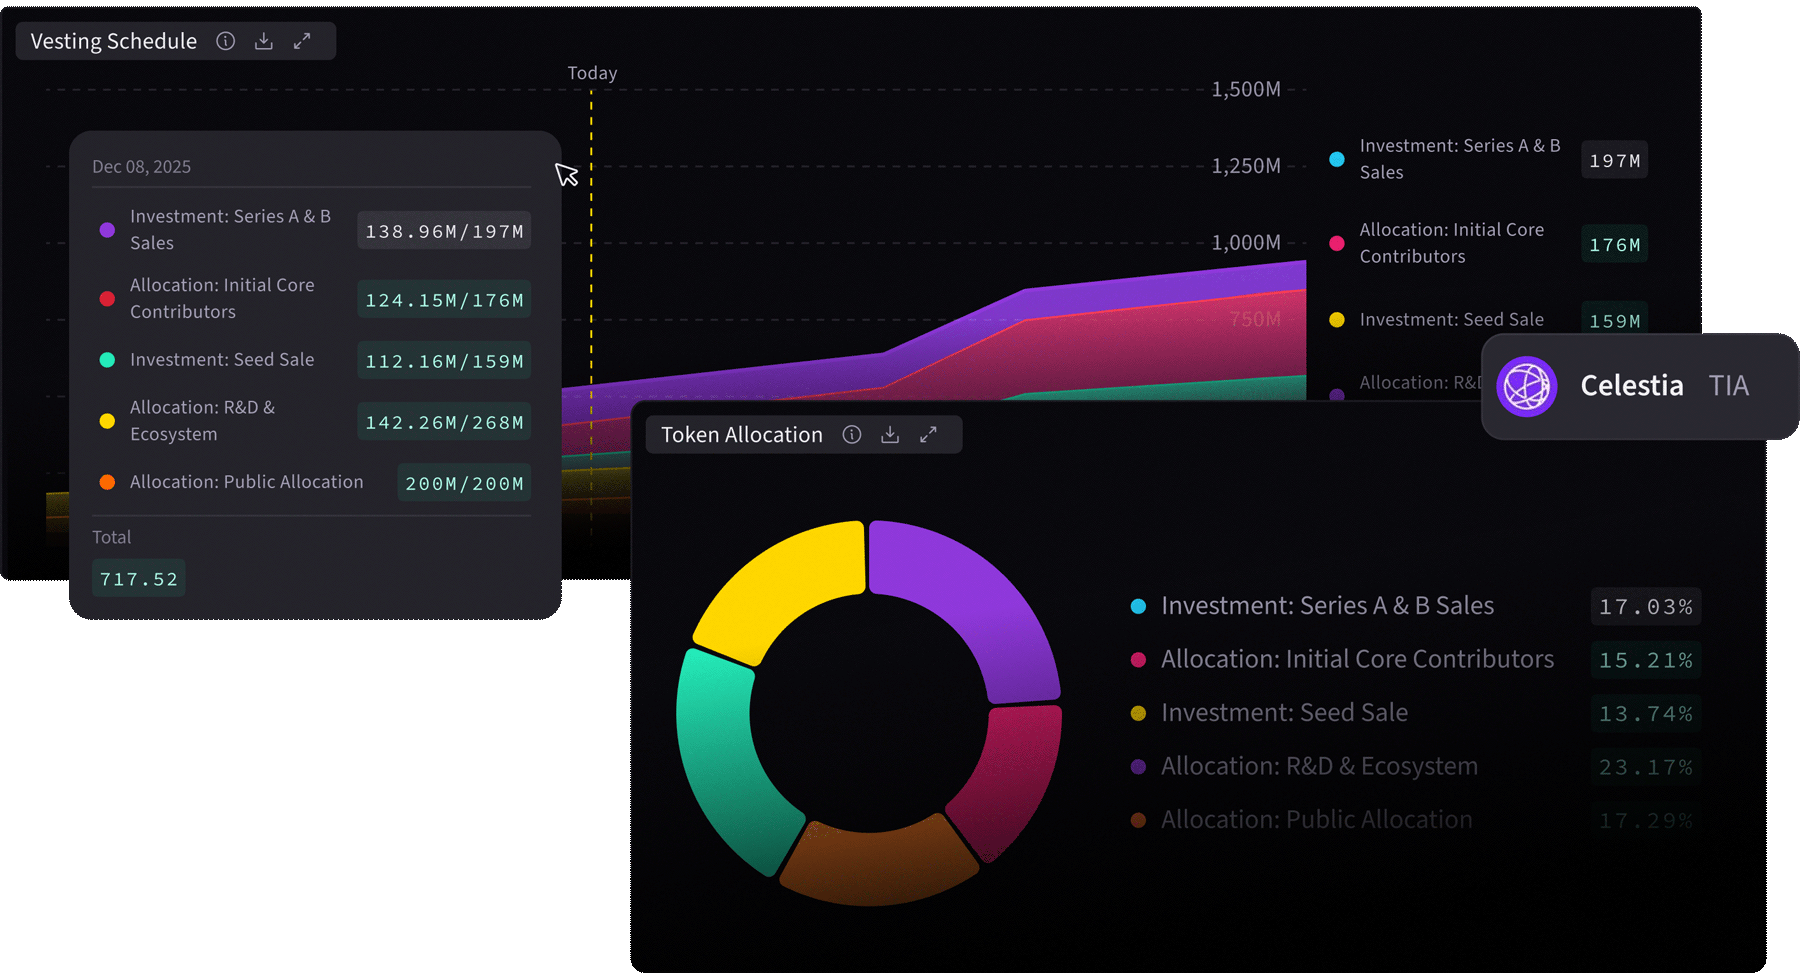
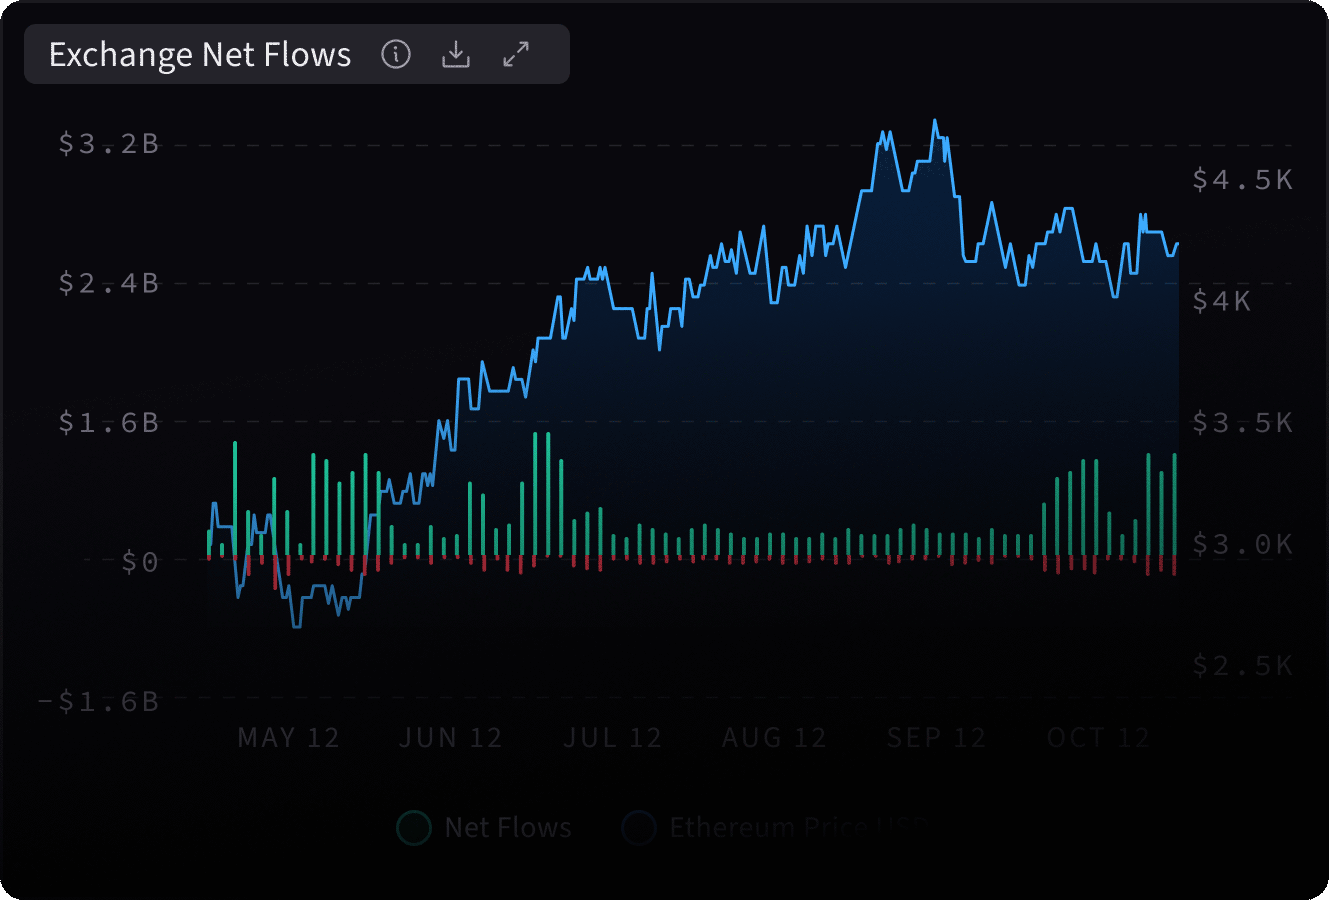
  • Comprehensive — spanning sentiment, news, token unlocks, developer activity, and on-chain fundamentals
  • Trusted — powering systematic trading, portfolio research, and enterprise platforms worldwide
Dark-themed cryptocurrency dashboard showing bitcoin sentiment data with code snippet on top, sentiment overview graph, and positive/negative sentiment percentages and predictions.
Track the Pulse of Digital Asset Investors

Sentiment API

Over 7+ years of comprehensive, point-in-time, out-of-sample Twitter history
Comprehensive coverage of over 500+ tokens with minute-level granularity, tracing back to 2017.
Powerful raw metrics that breakdown across different timeframes.
Bot and spam detection to ensure clean signal
Sentiment overview chart showing 78% positive and 22% negative sentiment with a rising line graph and JSON code snippet displaying Bitcoin sentiment data.
Every Story That Moves Markets

News API

Interface samples of JSON data and a news headline: 'BTC, ETH, SOL Outlook After Government Shutdown & NVDA Earnings' with neutral sentiment, tagged BTC, ETH, SOL, Illicit Activity, and Regulatory.
  • Over 6+ years of tagged, categorized news across 5,000–7,000 sources
  • Proprietary tagging by coin, company, event, and topic that filter out noise and deliver cleaner, more relevant news.
  • Beyond crypto pubs: SEC filings, court cases, regulatory rulings, token blogs, exchange updates
  • Built-in sentiment scoring
The Industry’s Most Accurate Dataset

Token Unlock API

Expertly selected by our dedicated analysts from a pool of around 200+ tokens.
Key resources include whitepapers, governance discussions, vesting agreements, and project dialogues.
Verified for accuracy - correcting widespread errors in public datasets
Dark-themed dashboard showing a vesting schedule graph with colored layers for investment and allocation categories, and a token allocation donut chart with corresponding percentages for Series A & B Sales, Initial Core Contributors, Seed Sale, R&D & Ecosystem, and Public Allocation.
True Visibility Into Project Activity

Developer Data API

  • Monitor repositories across leading projects for maximum impact.
  • Insights into the contributions of full-time, part-time, and freelance developers.
  • Metrics on commits, activity trends, and developer churn
  • See where developers are moving across ecosystems
Chart showing net new developers for Polygon and one other asset over six months with commits 5+. Table lists churning developers with their previous repositories and rankings, including developers chriseth, franzihei, fredriksvantes, aaronisme, and aarit.
Cross-Chain Fundamentals Made Simple

On-Chain API

Graph showing exchange net flows as vertical bars and Ethereum price in USD as a blue line from May to October, with Ethereum price rising from around $2900 to above $4500 before slightly declining.
  • Extensive coverage spans over 50+ diverse chains,.
  • Access a wide range of on-chain metrics, including users, transactions, fees, TVL, and more
  • Designed for effortless comparison and clarity.

Looking to empower your customers with our data?

Many of the world’s largest exchanges, platforms, and financial institutions use The Tie’s APIs to deliver data directly to their customers.

  • Quant Funds rely on our data to drive alpha generation and optimize execution strategies.
  • Asset Managers harness our powerful APIs for in-depth fundamental analysis and effective portfolio monitoring.
  • Enterprises use our data to fuel cutting-edge research portals, dynamic trading systems, and robust internal platforms.