
An expanded Tezos dashboard: L1, Etherlink, RWAs, and Exchange activity in one view

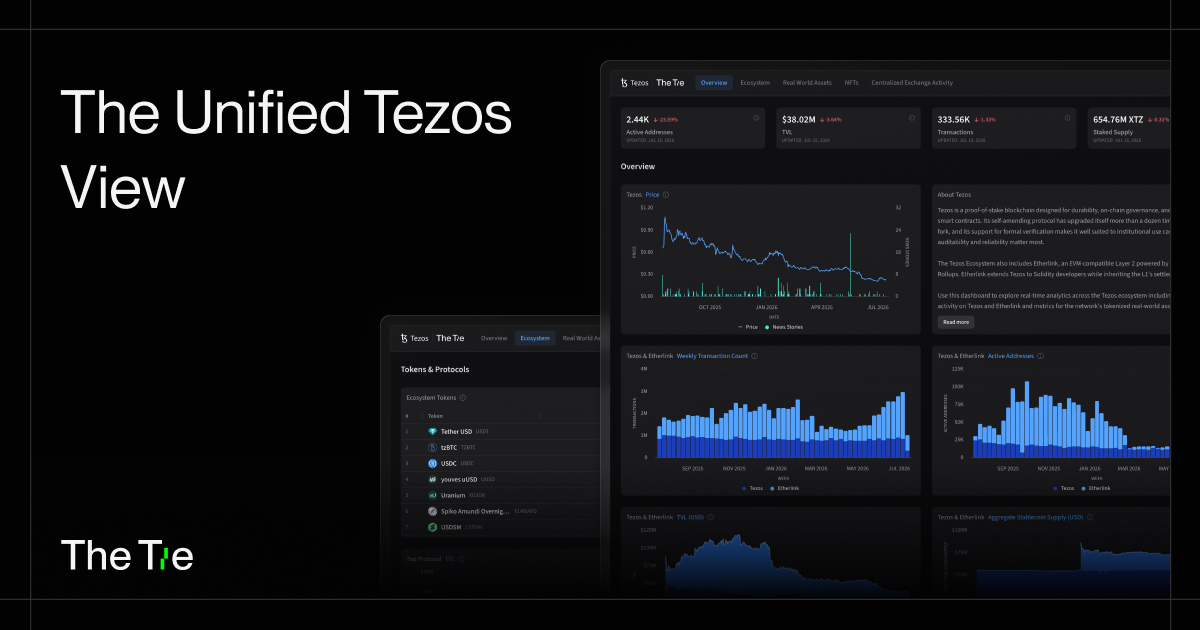
The Tezos ecosystem dashboard built by The Tie has been rebuilt into a far more comprehensive research tool. It now brings the full chain into a single view, covering Tezos L1, Etherlink, real-world assets, NFTs, and centralized exchange activity, organized the way institutions actually evaluate any blockchain.
The state of the chain at a glance
A row of KPI cards now sits at the top of the overview: active addresses, TVL, transactions, and staked supply. Each shows its current value, the percentage change, and the date it was last updated. Before going deeper into any single chart, you get an immediate read on whether the network is expanding or contracting, and how fresh the data is.
Tezos and Etherlink, one system
A theme running through the dashboard is Etherlink, Tezos's EVM-compatible Layer 2. Rather than living on a separate page, it is built into every core chart on the overview. Weekly transaction count, active addresses, TVL, aggregate stablecoin supply, and daily average TPS all show Tezos L1 and Etherlink together. Seeing them together gives a complete picture of a single ecosystem.
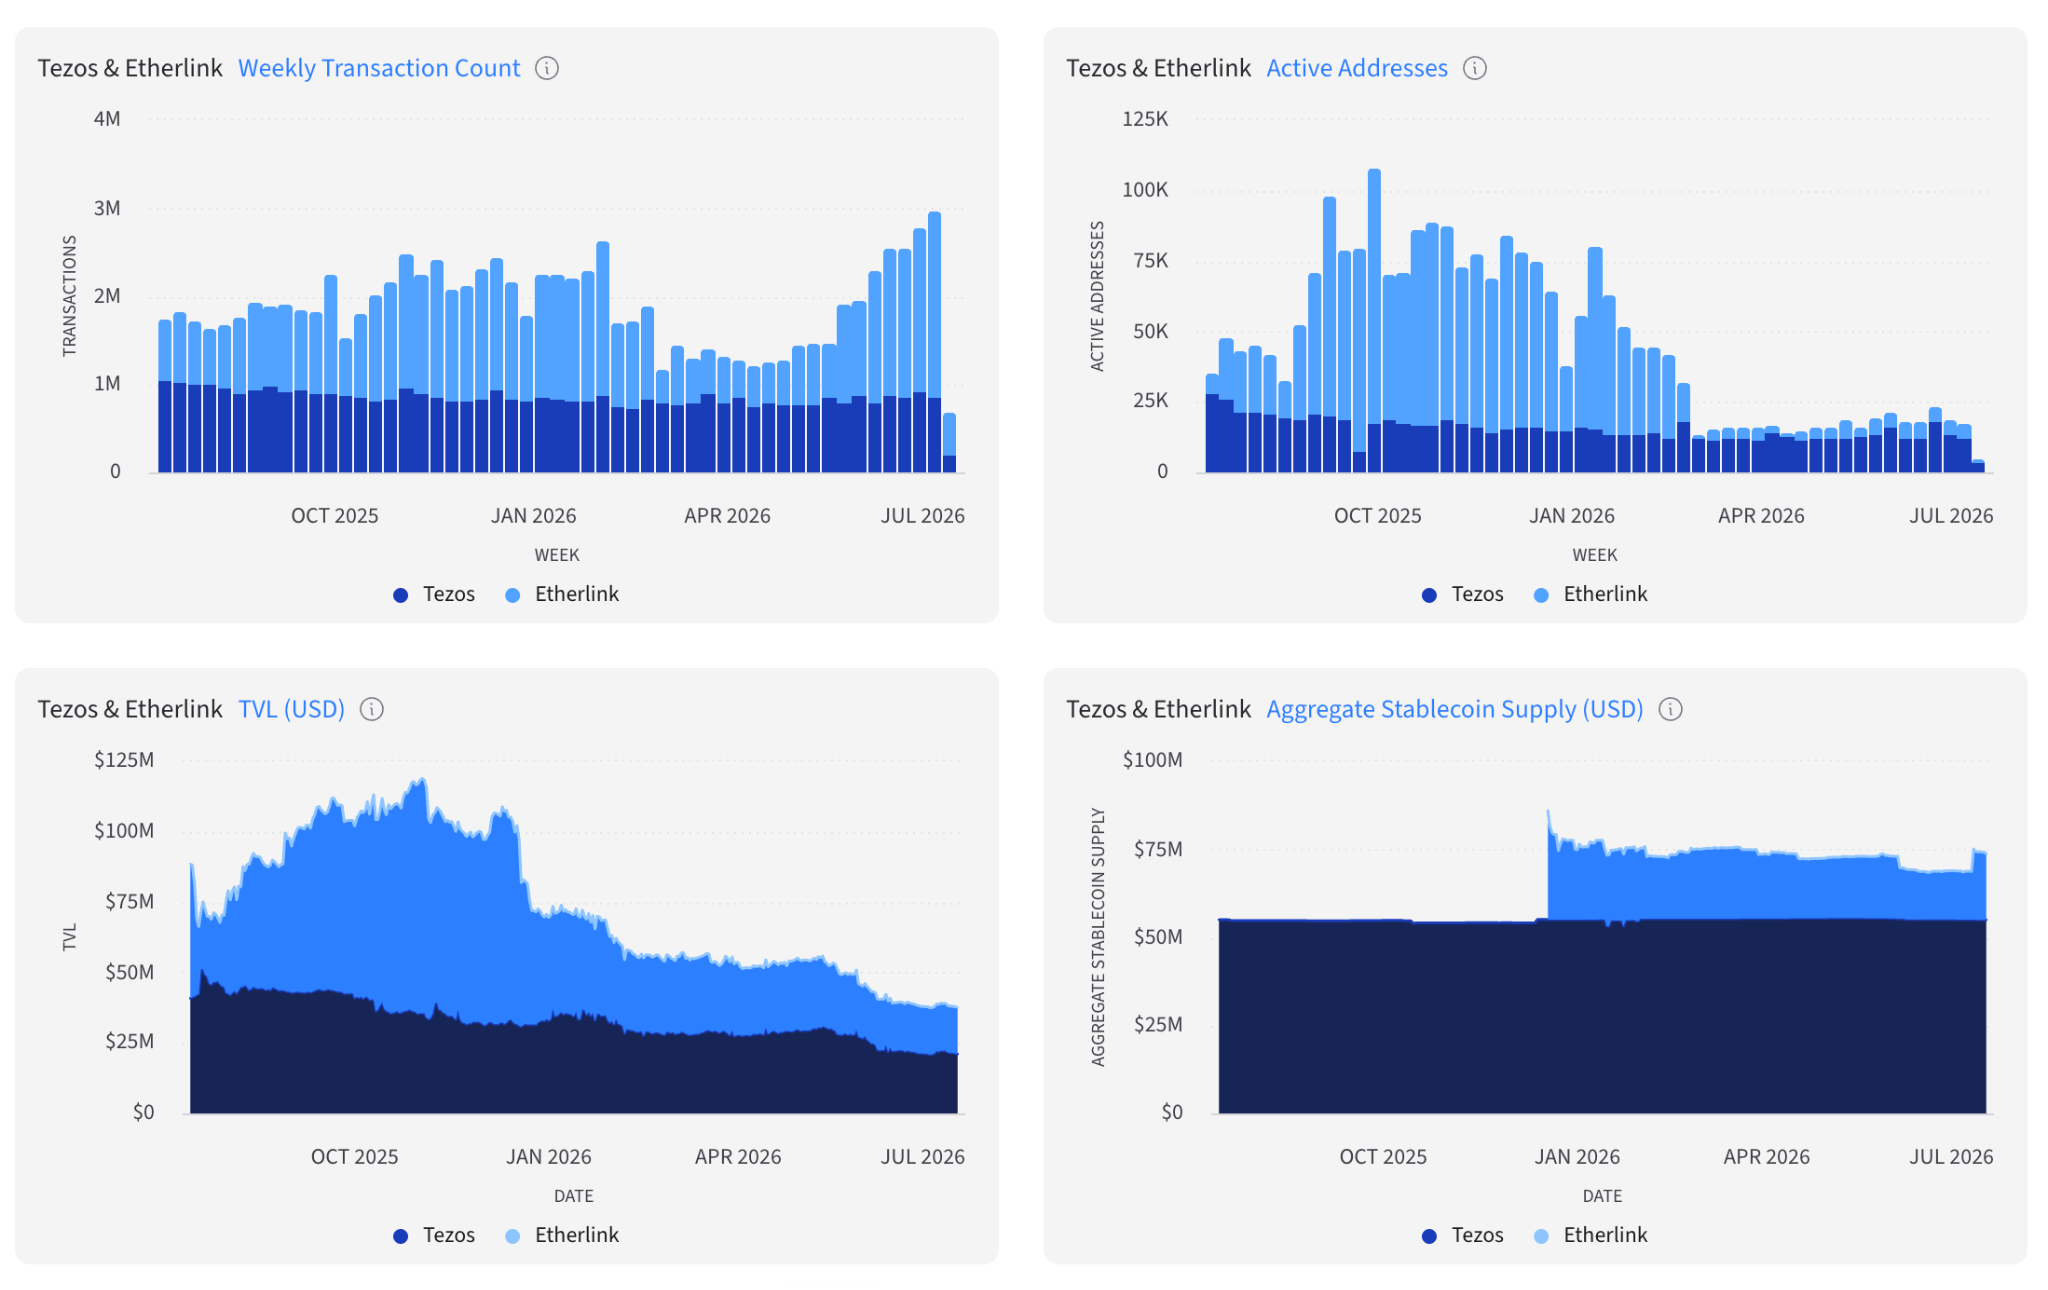
This reflects where Tezos is heading. Under the Tezos X roadmap, the goal is for Tezos X to be activated as an upgrade of Etherlink, with the Michelson and EVM interfaces live and fully composable. In that model, builders tap into Etherlink's liquidity while getting contracts formally verified through the Michelson interface, so L1 and L2 work as one composable whole. The dashboard tracks them together because that is increasingly how the ecosystem functions: shared liquidity, combined activity, one chain.
RWA view that gets specific
Most RWA dashboards stop at a category label. This one goes to the asset. The Real World Assets tab leads with tokenized uranium (xU3O8), tracking cumulative wallet growth, on-chain usage, the top contracts by transfer volume, and a cumulative returns spread against $SRUUF, a reference for the underlying uranium trade.

It is paired in the ecosystem tokens by Amundi's money market fund, tokenized through Spiko (EURSAFO). Between a tokenized commodity and a tokenized fund from one of the largest asset managers in Europe, the RWA view reflects the kind of issuance institutions are actually watching, not a generic placeholder.
A more diversified DeFi landscape
The Ecosystem tab tells its own story. TVL is no longer concentrated in a single protocol. It now spreads across Youves, Curve DEX and Curve Finance, Spiko, Uranium.io, UltraYield, Morpho, and Uniswap, a mix of native Tezos protocols and EVM-native names arriving through Etherlink. Stablecoins lead the ecosystem tokens, with USDT and USDC at the top, a marker of where settlement and liquidity are anchoring.

CEX activity, at the microstructure level
The Centralized Exchange Activity tab covers where XTZ liquidity sits and how it trades. A markets table lists price, bid/ask spread, and 2% order book depth on both sides for each venue, from Binance and HTX to regional exchanges, ranked by 24-hour volume. A price-return matrix runs from one-hour through 365-day changes, month-to-date, and quarter-to-date, against both USD and BTC. An exchange net flows chart plots flows on and off exchanges against price.

This is the data a trading desk uses to judge how tradable an asset is and how much size the book can absorb, now in the same tool as the on-chain data.
More context, more signal
Several additions round out the picture:
- Community discussion that tracks podcast mentions alongside X activity.
- Deep NFT analytics, from marketplace share and mints versus minters to top collections, traders, and earnings.
- A light mode, alongside the existing dark view.
The same infrastructure behind our institutional products
The dashboard runs on the same data infrastructure that powers The Tie's institutional products.This rebuild points that infrastructure at the full Tezos and Etherlink ecosystem and organizes it the way institutions evaluate one: state of the chain first, then activity, capital, real-world assets, and the liquidity behind it all.
Explore the dashboard: https://tezos.thetie.io/