The Tezos Dashboard on The Tie Terminal Just Got More Comprehensive

The Tezos Dashboard on The Tie Terminal has been updated and expanded. The dashboard now incorporates Etherlink data alongside existing Tezos coverage, giving institutional clients a more complete view of the full network -- tracking performance, analyzing assets, and monitoring market dynamics across both layers in one place.
The dashboard is accessible directly within The Tie Terminal for existing clients.
Tezos and Etherlink
Tezos is a proof-of-stake blockchain with a long track record in institutional tokenization, NFTs, and real world asset infrastructure. Etherlink is an EVM-compatible layer built on Tezos, designed to bring Ethereum tooling and liquidity into the ecosystem. With Etherlink's integration into the dashboard, The Tie Terminal now tracks activity across both layers, giving users a unified and more complete view of the Tezos network than was previously available.
What the Dashboard Covers
The dashboard spans five core areas, each designed to give institutional investors a complete and actionable picture of the Tezos ecosystem.
1. Onchain Usership and Overall Blockchain Metrics
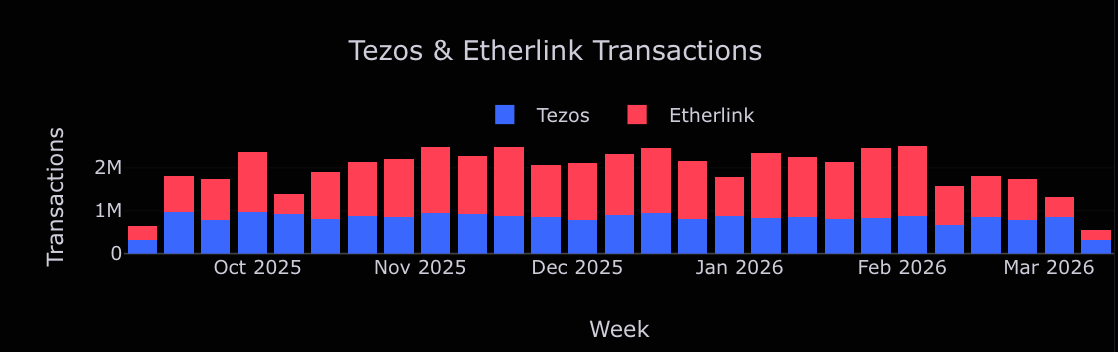
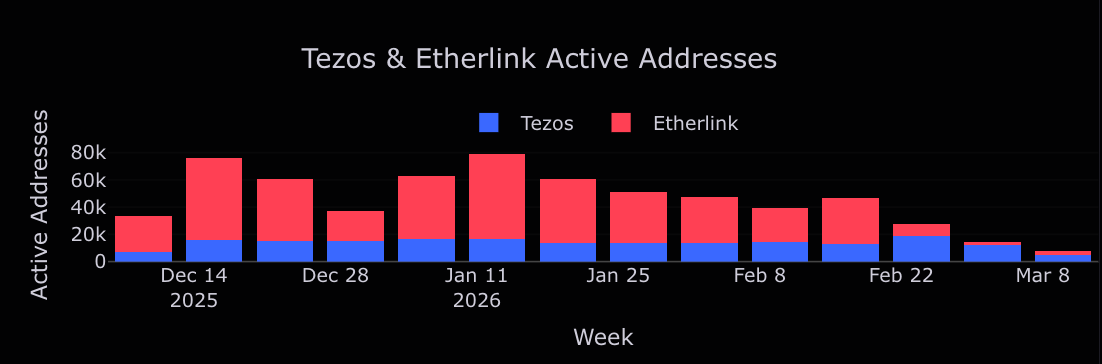
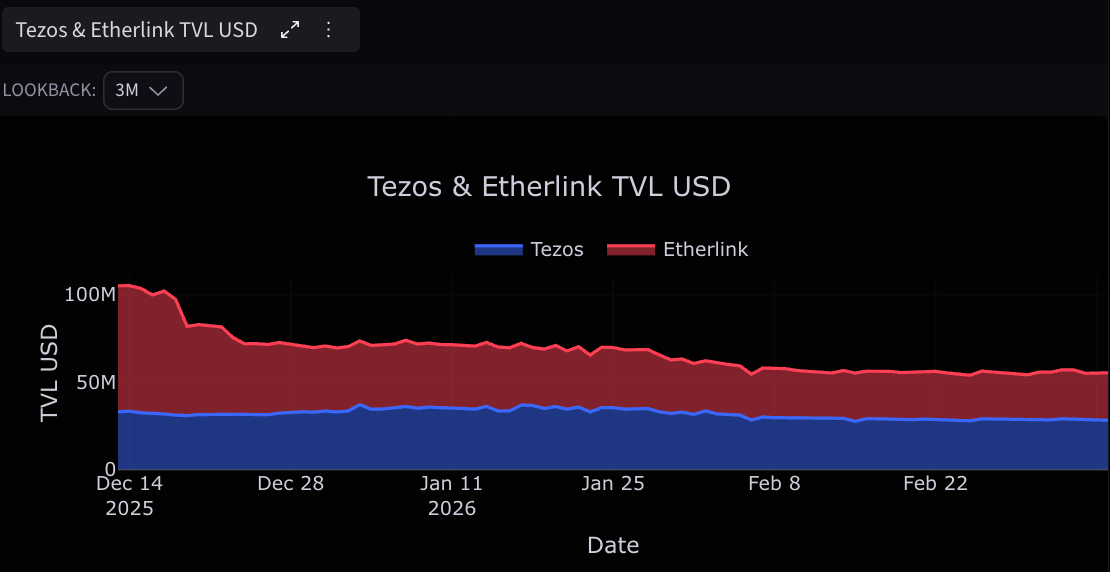
The dashboard opens with a high-level view of network activity, covering weekly transaction counts, weekly active addresses, Total Value Locked (TVL), stablecoin supply, and daily average TPS. The data now tracks both Tezos and Etherlink, reflecting the full scope of activity across the network. Over the past year, combined weekly transactions have ranged between 1M and 3M+, with active address counts peaking above 100K weekly in mid-2025 and combined TVL reaching a high of ~$100M.
For institutional investors, these metrics provide a ground-level view of how actively the network is being used and how that activity has evolved over time. Some screenshots:
2. Ecosystem Focus
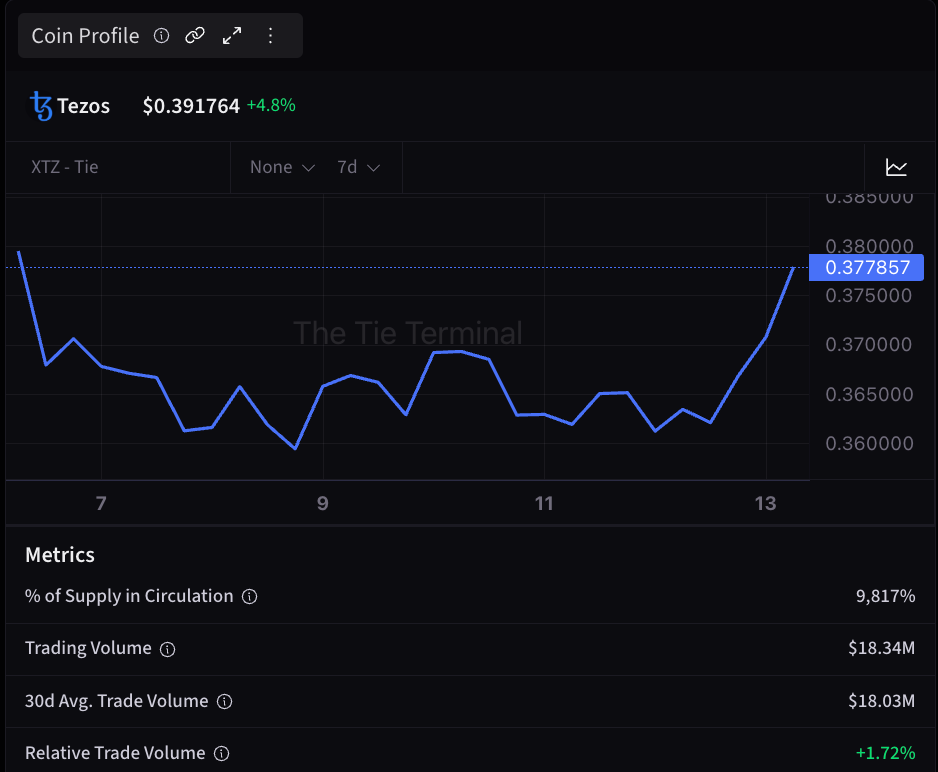
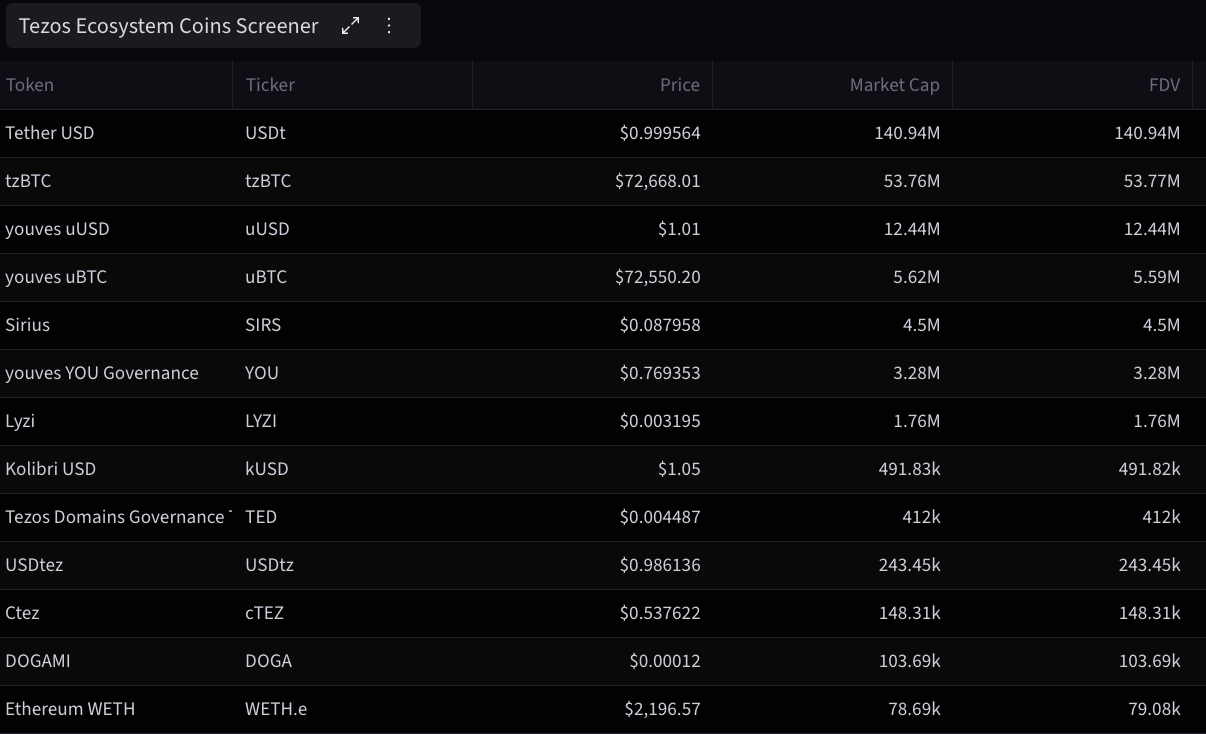
The Ecosystem Focus section gives users a dedicated view of XTZ market data alongside a full screener of Tezos ecosystem tokens, which includes wrapped assets like tzBTC, stablecoins, governance tokens, and ecosystem projects. This comprehensive look allows users to monitor market cap and trading activity across the entire token landscape.
3. Real World Assets
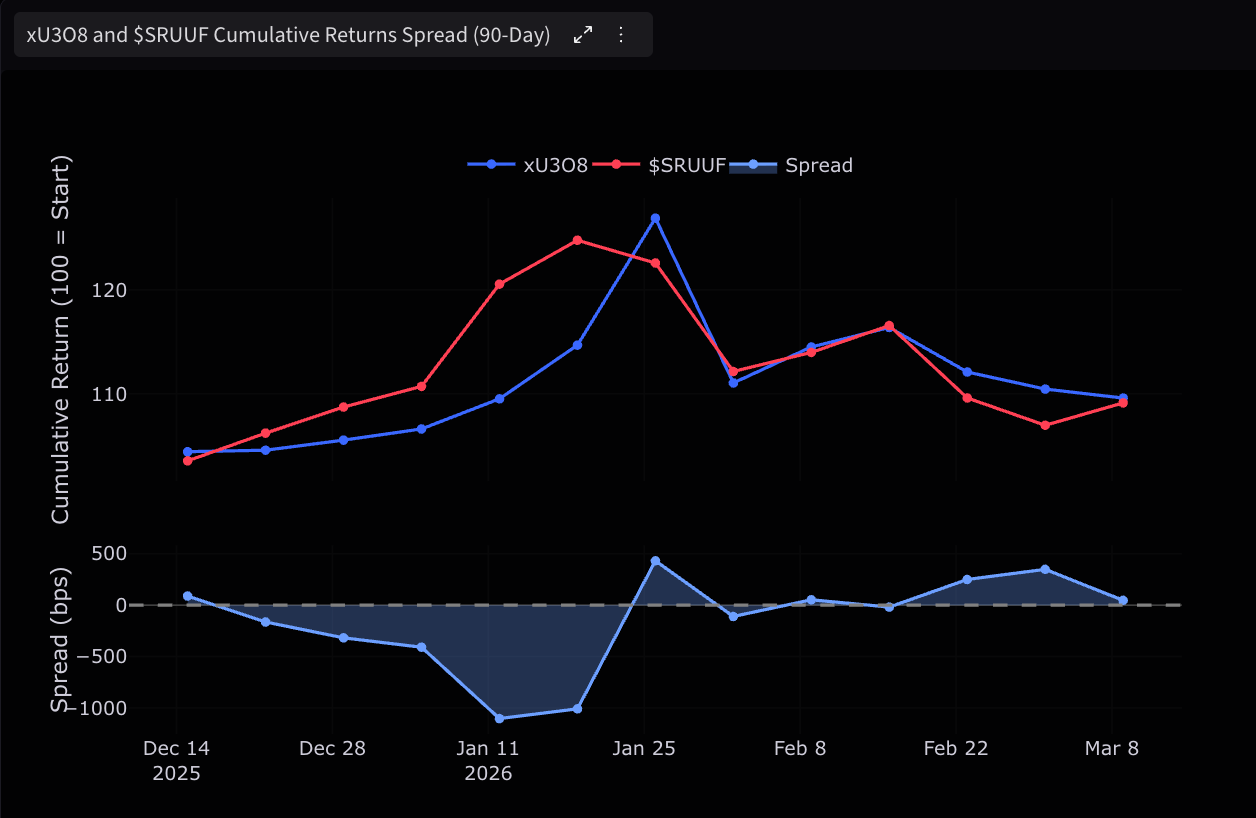
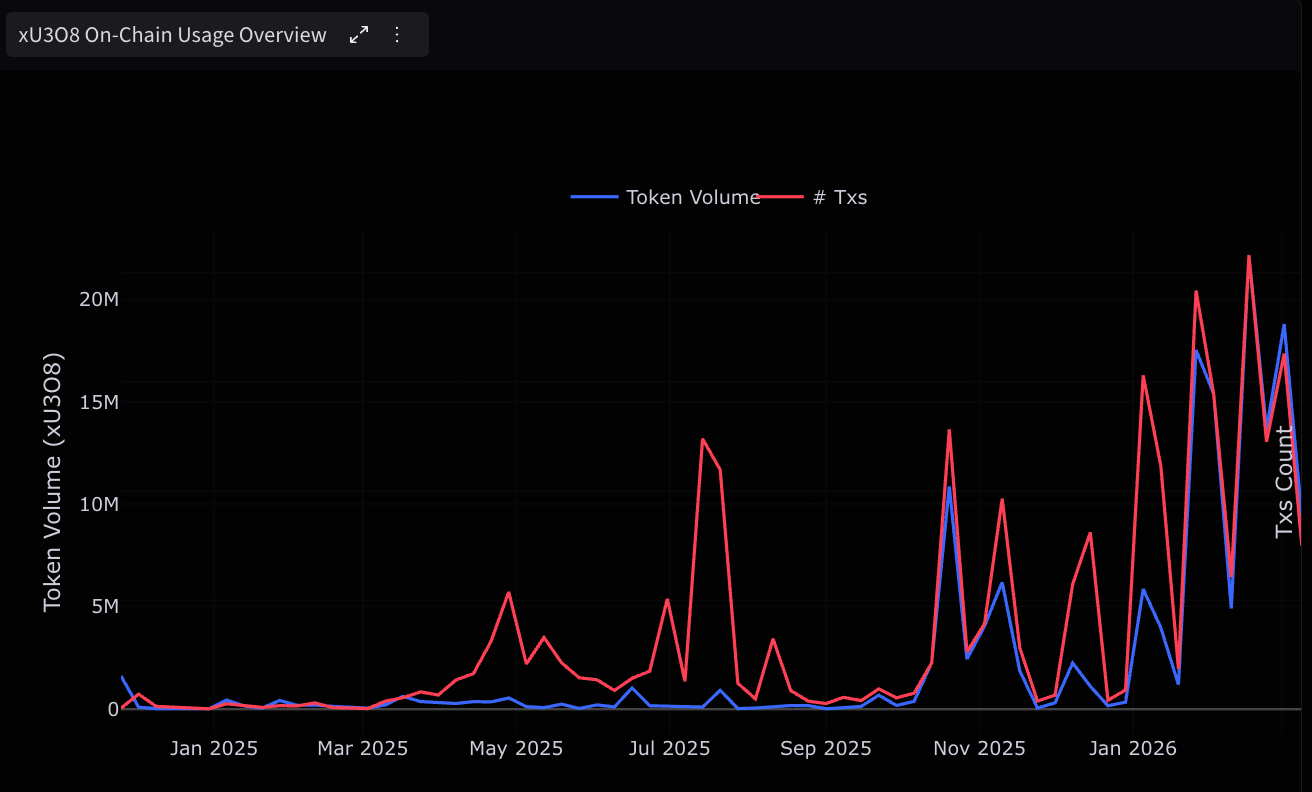
One of the more differentiated sections of the dashboard is the Real World Assets coverage. Tezos has emerged as a meaningful chain for tokenized real world assets, and the dashboard tracks this directly. The RWA section currently focuses on xU3O8, a tokenized uranium product built on Tezos, covering wallet count, on-chain usage trends, top contracts by transfer volume, and a 90-day cumulative returns comparison between xU3O8 and its traditional market equivalent, $SRUUF.
This type of coverage is directly relevant to institutional investors tracking how real world asset tokenization is playing out across different chains and Tezos is an active participant in that space. Here’s a snippet:
4. NFT Ecosystem Activity
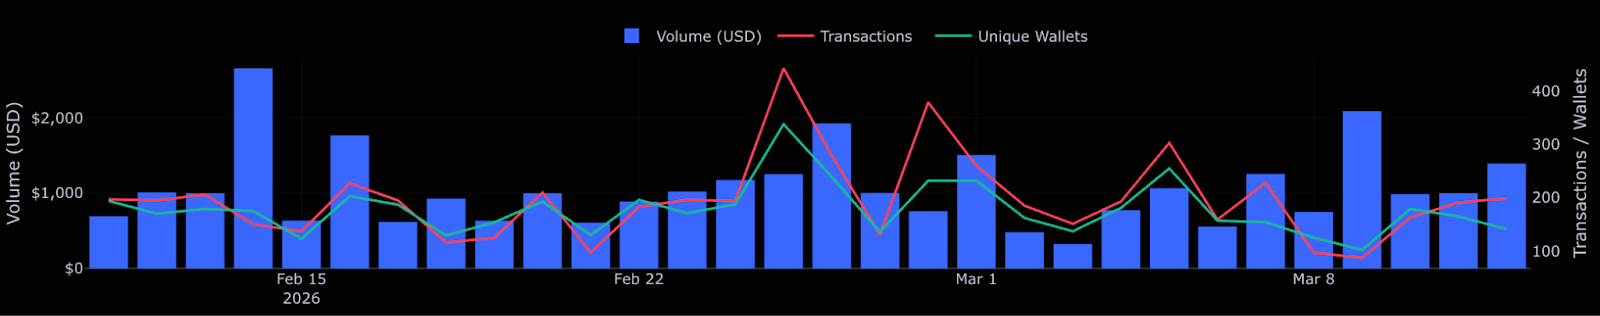
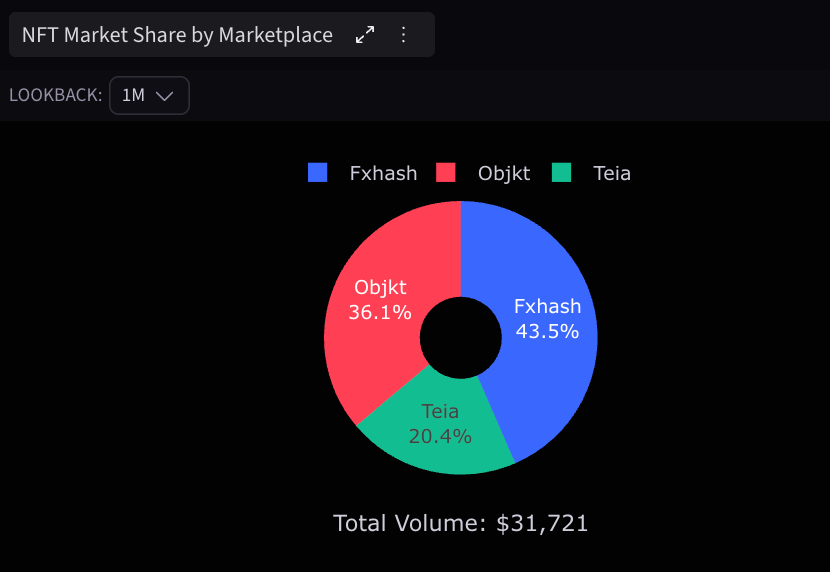
Tezos has a well-established NFT ecosystem, and the dashboard covers it with market-level data across all leading marketplaces. Users can track daily NFT volume, transaction count, and unique wallet activity, along with marketplace-level breakdowns. Over the past month, Fxhash has held the largest share of volume at 43.5%, followed by Objkt at 36.1% and Teia at 20.4%. The marketplace breakdown provides a clear view of where NFT activity on Tezos is actually concentrated.
5. Liquidity and Market Access
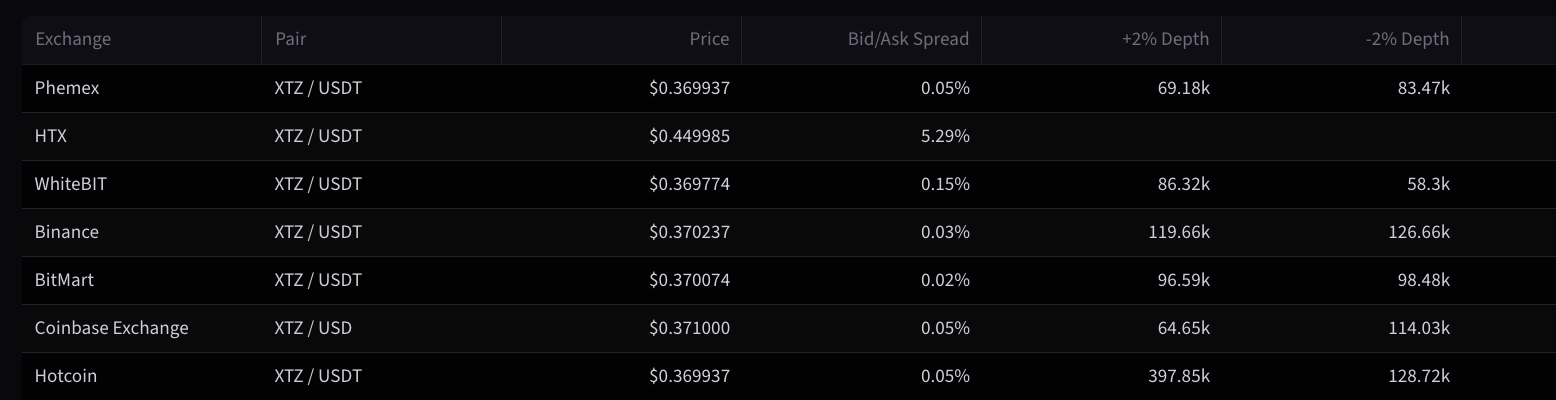
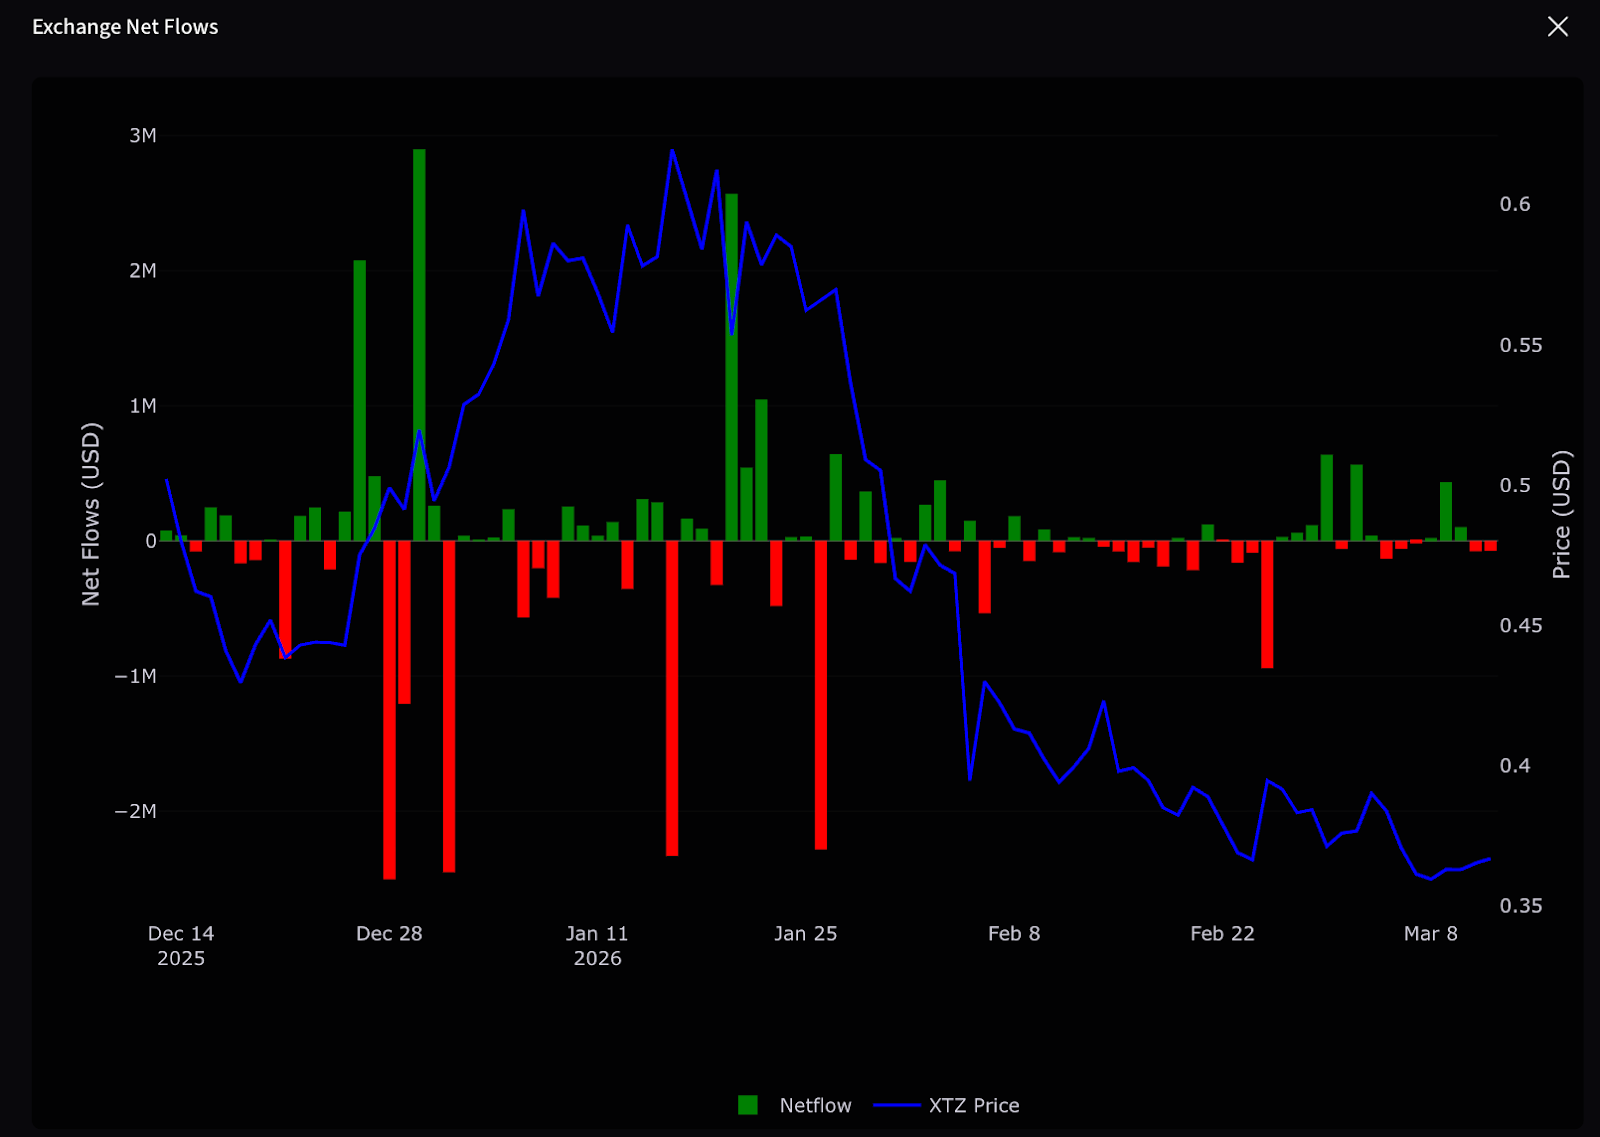
The Liquidity and Market Access section pulls together exchange-level data for XTZ across all major trading venues, including bid/ask spreads, market depth, and 24-hour volume by exchange. It also shows the exchange net flows chart to track how XTZ is moving on and off exchanges over time. For investors assessing execution quality or monitoring market structure, this section provides the data they need in one view. Some snippets:
A Unified View for Institutional Research
The Tezos Dashboard brings together network analytics, token market data, real world asset tracking, NFT activity, and liquidity metrics in a single, structured dashboard. Rather than piecing together data from multiple sources, institutional clients can now access a comprehensive view of the Tezos ecosystem directly within The Tie Terminal -- alongside coverage of every other major network the Terminal supports.
Access the Dashboard
The dashboard is live now for all users of The Tie Terminal and can be found under “New and Trending” section. If you're not yet a user of The Tie Terminal and want to see the dashboard in action, contact us to schedule a demo.