The New Tie Terminal is the all-in-one platform for institutional crypto. With its unmatched breadth and depth of data coverage, combined with a suite of powerful, customizable tools, The Tie Terminal provides an all-in-one solution to stay on top of the crypto market.
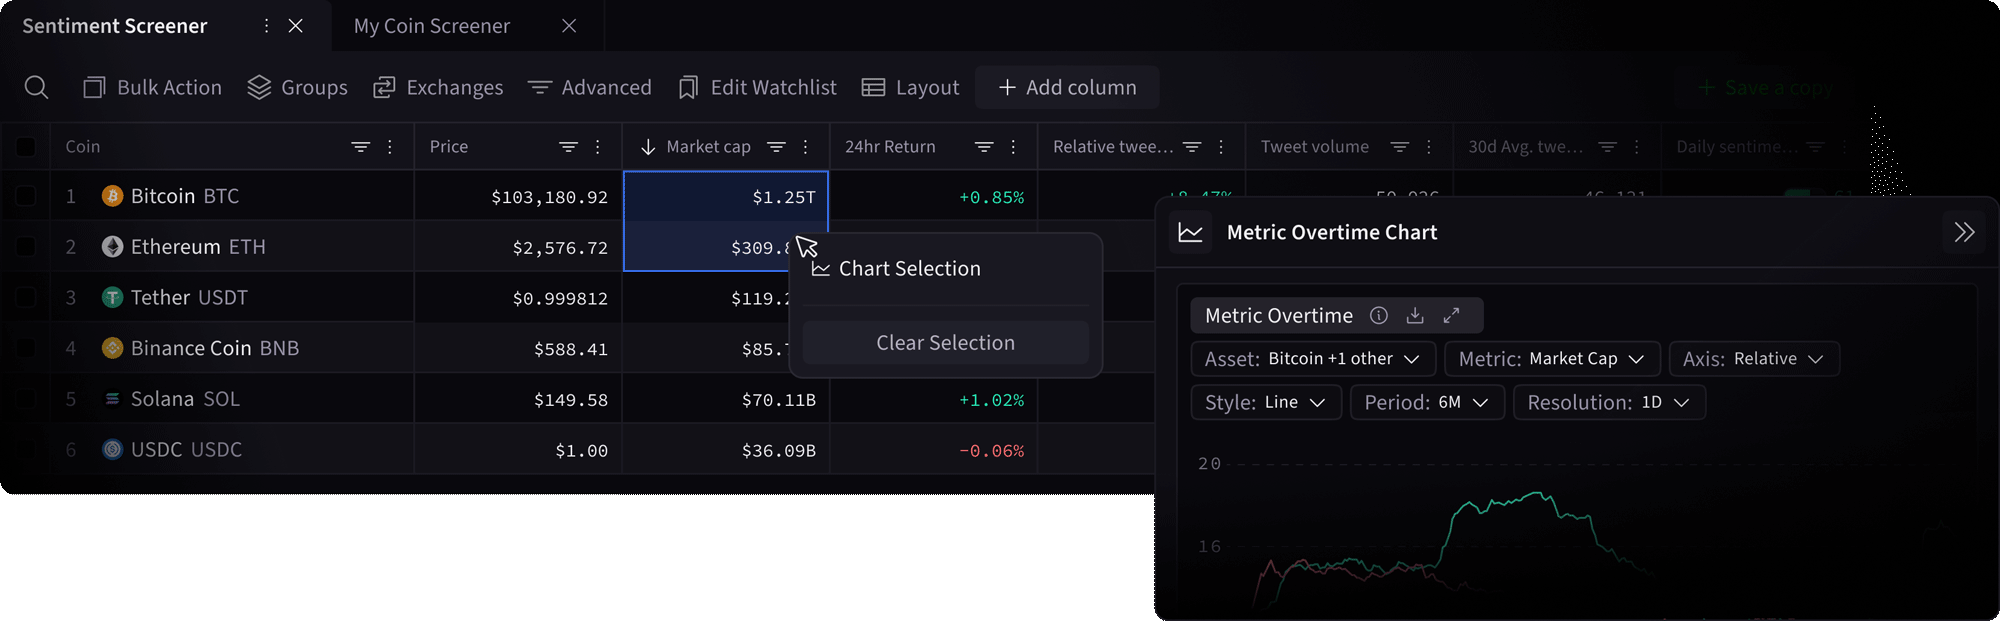

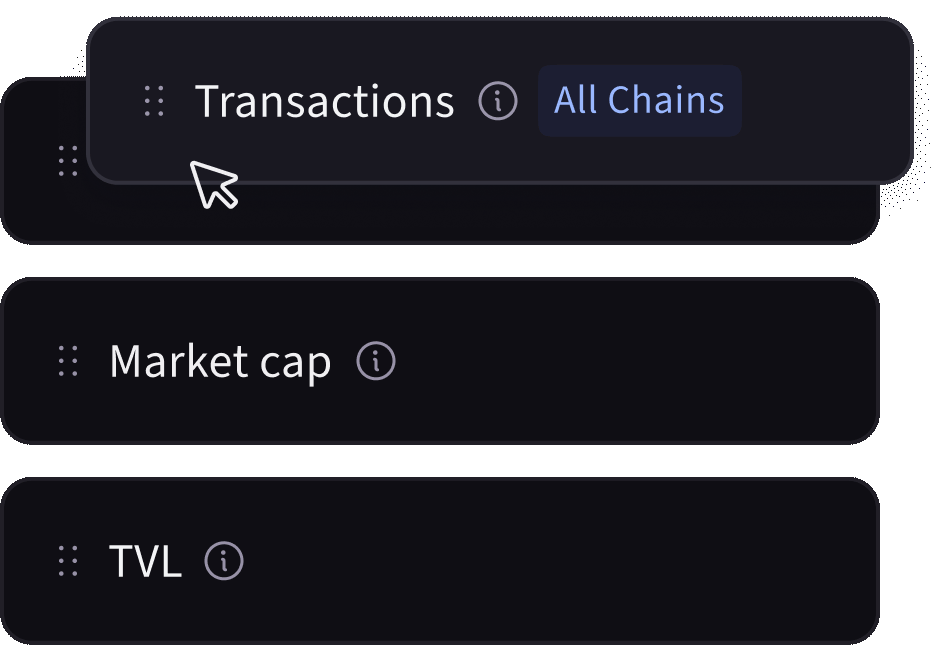

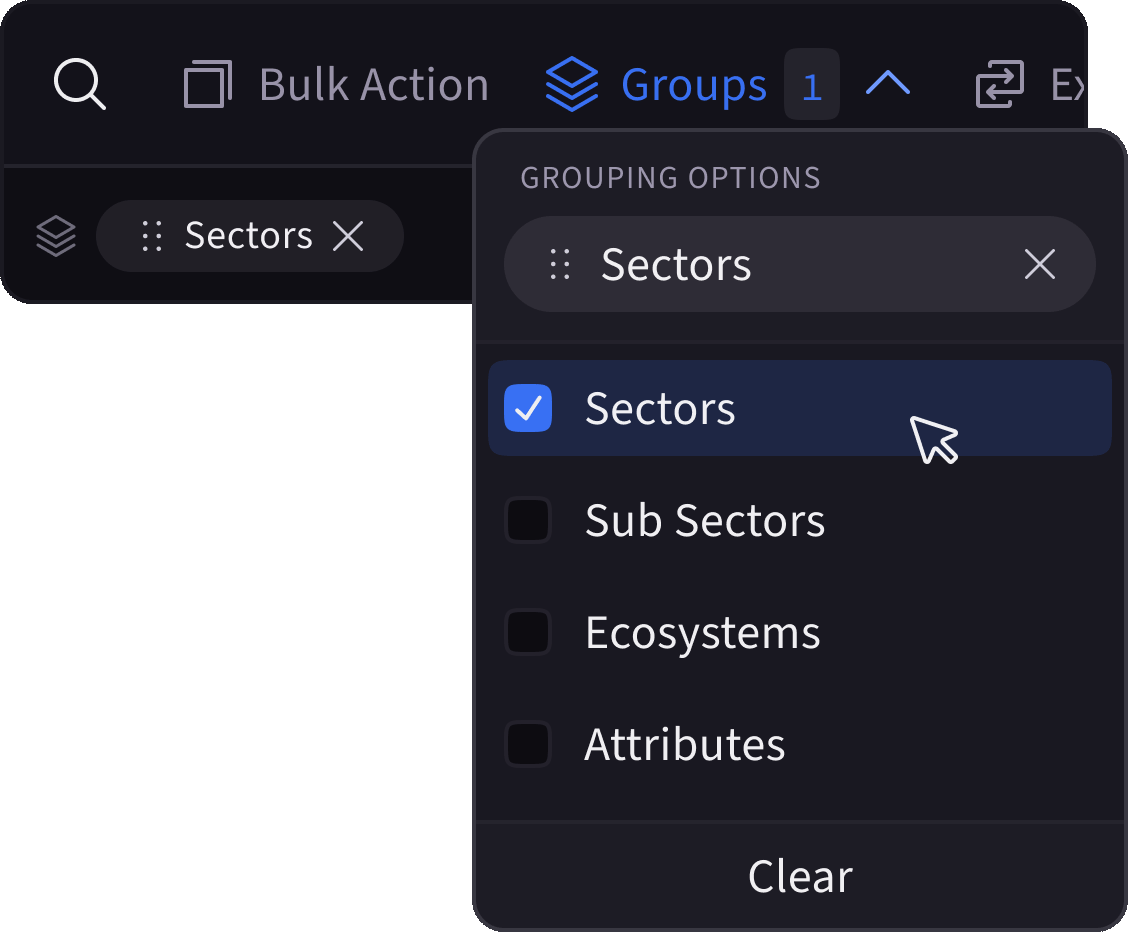

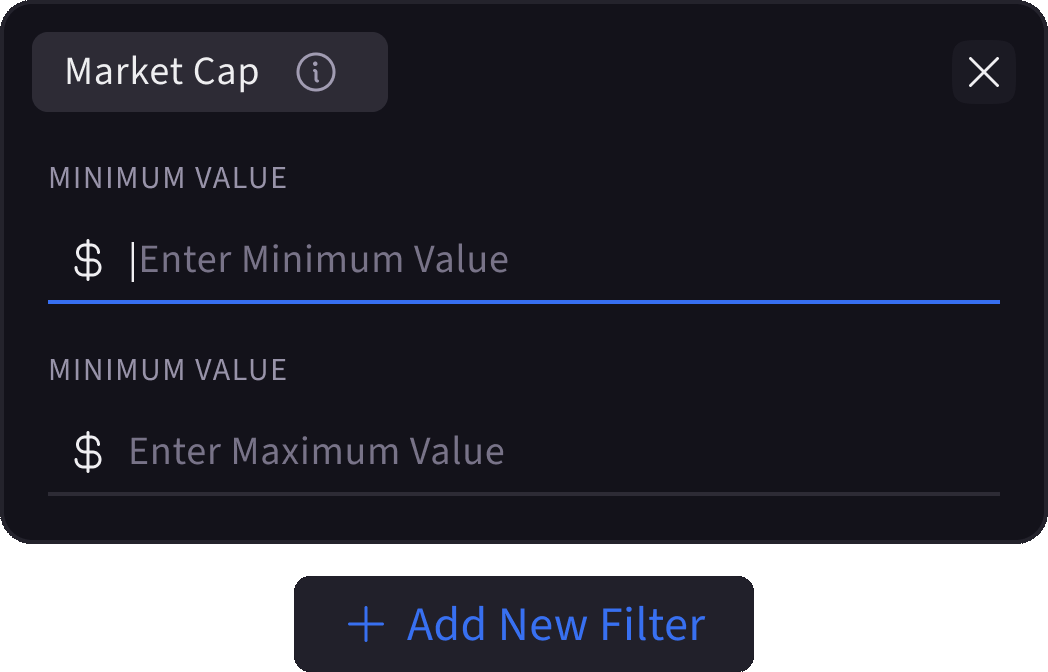


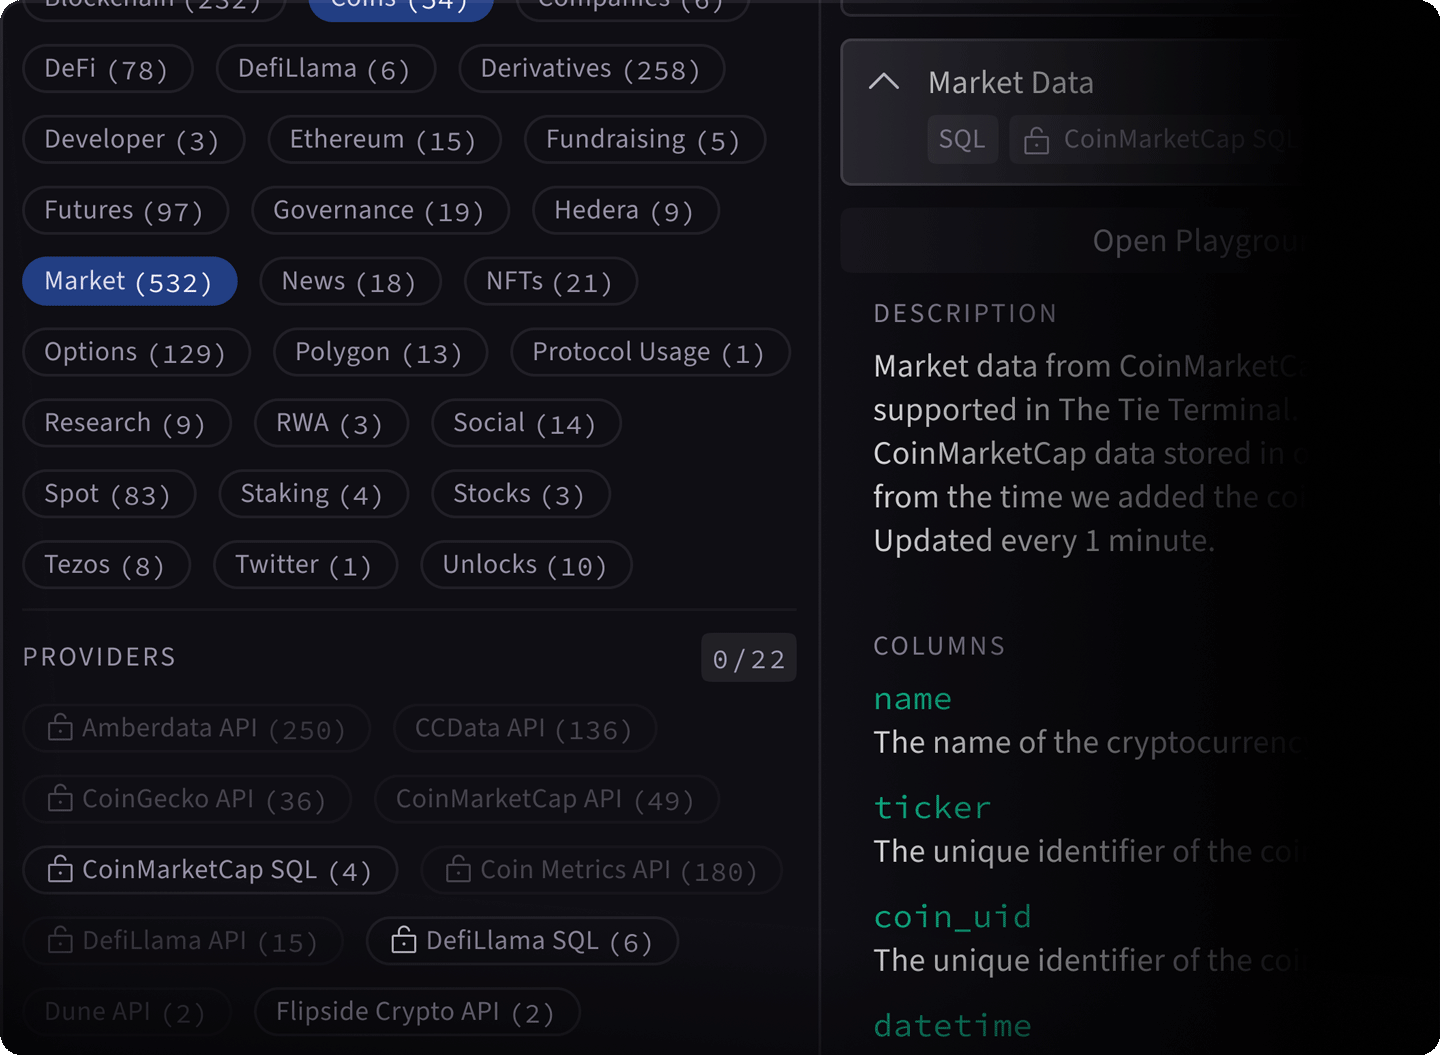
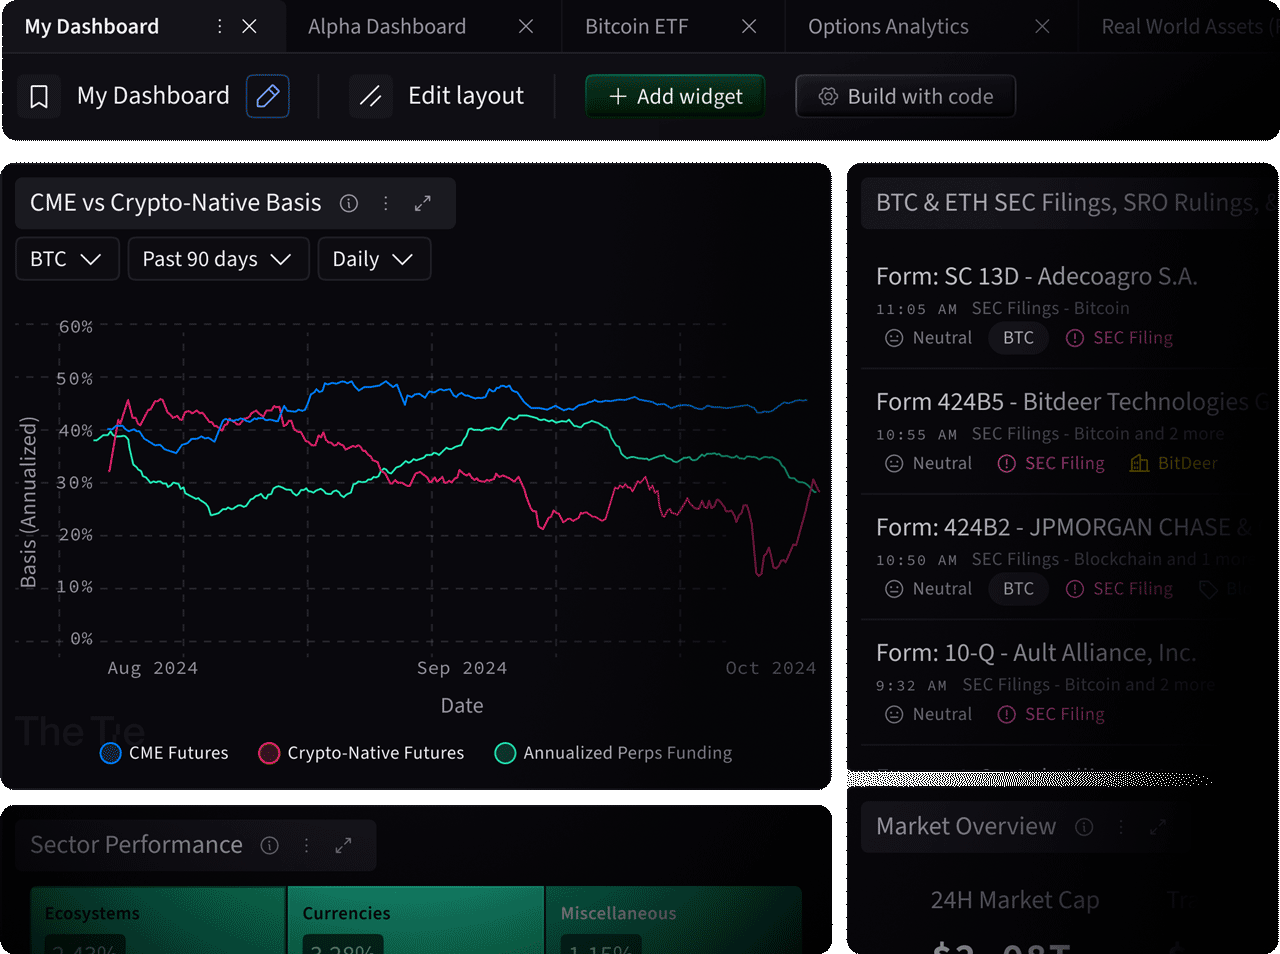


Examine any asset or sector using diverse metrics and timeframes. Incorporate news, unlocks, or token movements to uncover performance drivers. Dig deeper to identify the real signals behind market activity.

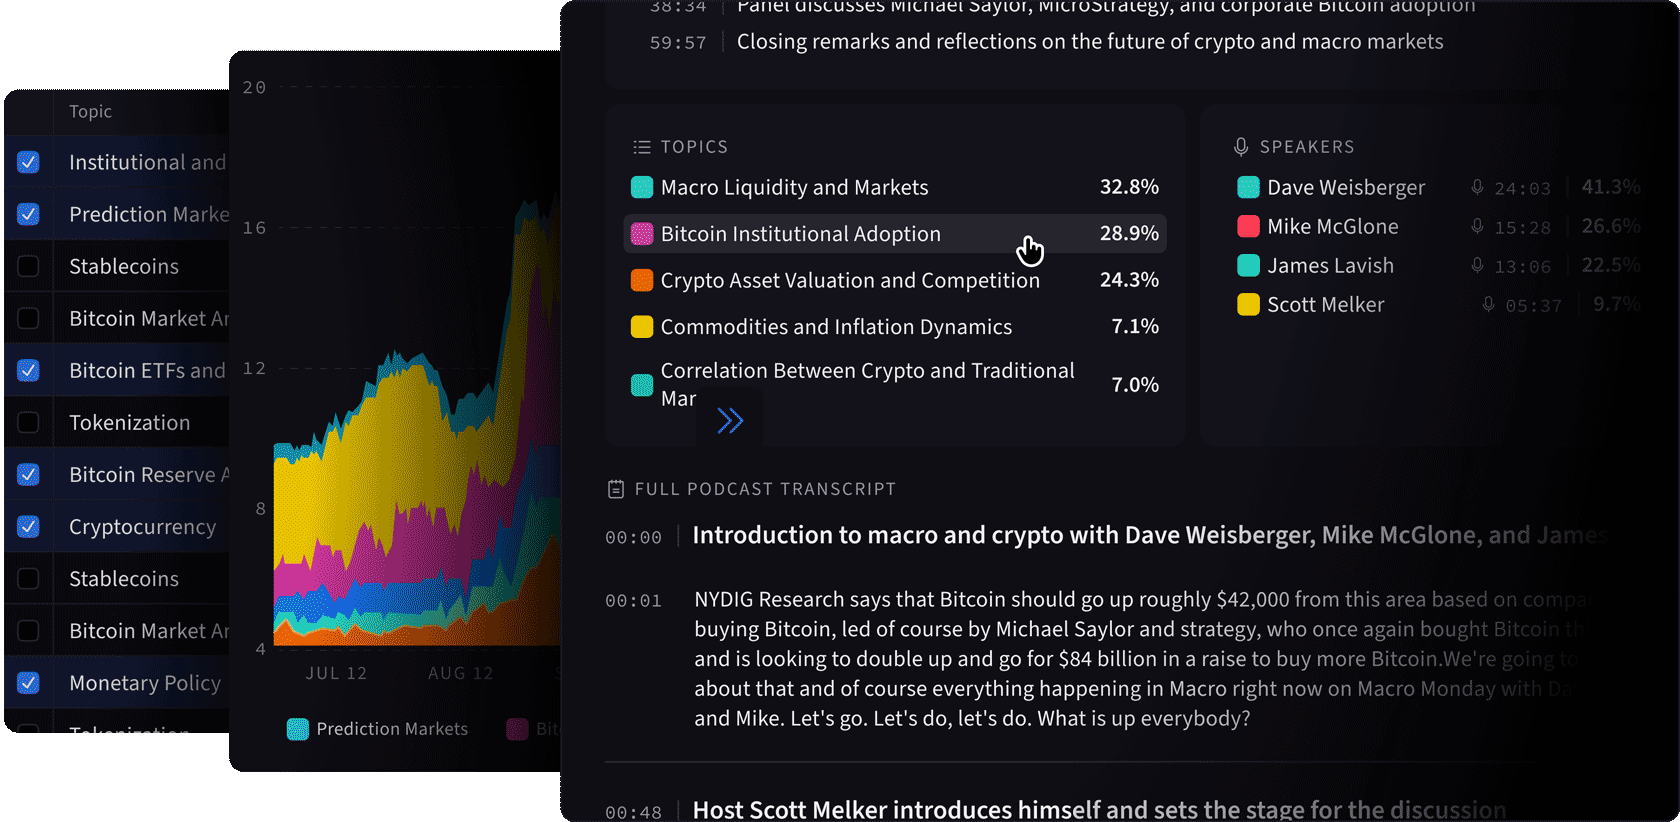
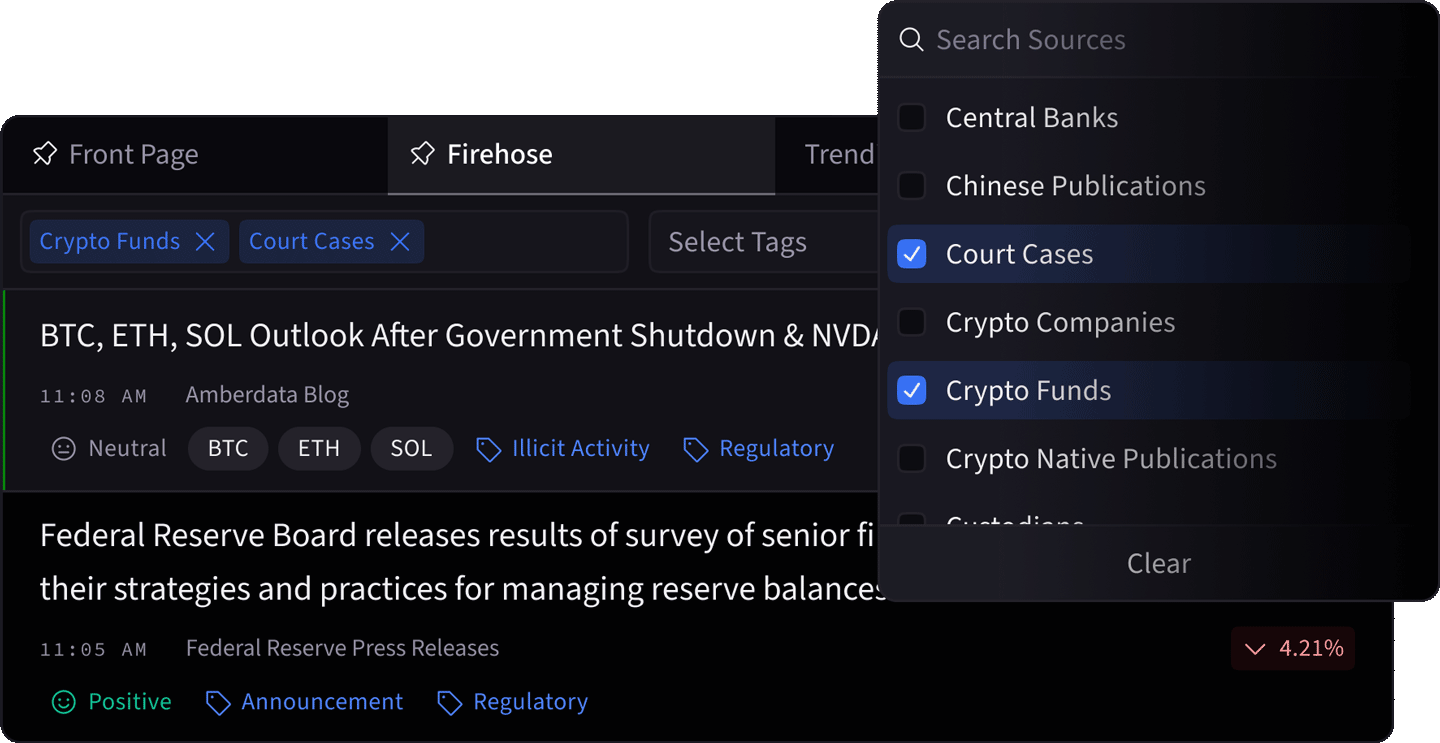
Monitor the evolution of market themes across media and research in real time. AI transforms complexity into clarity.