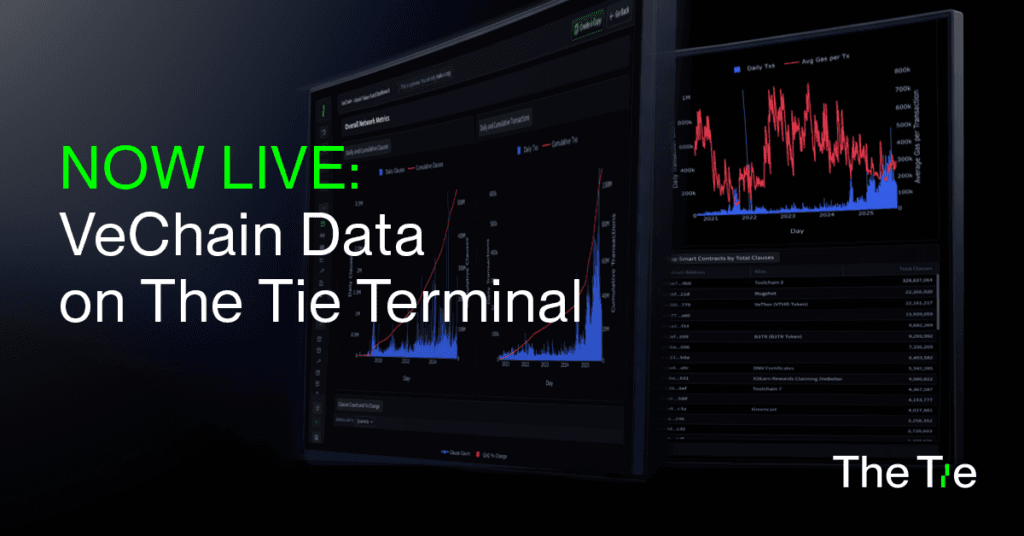
We’re excited to announce the rollout of the VeChain Network Overview Dashboard along with the integration of VeChain onchain data across the Terminal and in our On-Chain API.
The Tie x Vechain
Introducing VeChain Data on The Tie Terminal
By Hari Iyer
October 30, 2025
With this release, institutional clients have access to a comprehensive suite of analytics covering VeChain’s onchain activity, including Clauses, transactions, user behavior, developer activity, gas dynamics, and governance participation. The integration enables users to analyze VeChain alongside other leading Layer 1 networks supported on The Tie Terminal, offering a consistent framework for comparing ecosystem performance and growth.
VeChain's unique architecture, with its dual-token system and Clause-based transaction model, requires specialized analytics that go beyond standard onchain metrics. The VeChain Network Overview Dashboard provides a high-level overview of the network’s performance, while data from VeChain is also available across The Tie Terminal for deeper analysis.
Here’s a glimpse into some of the metrics that you can track on the VeChain Network Overview Dashboard:
1. Overall Network Metrics
This section aggregates key metrics and charts that capture how VeChain is used from Clause and transaction activity to user engagement, smart contract deployment, and gas consumption.
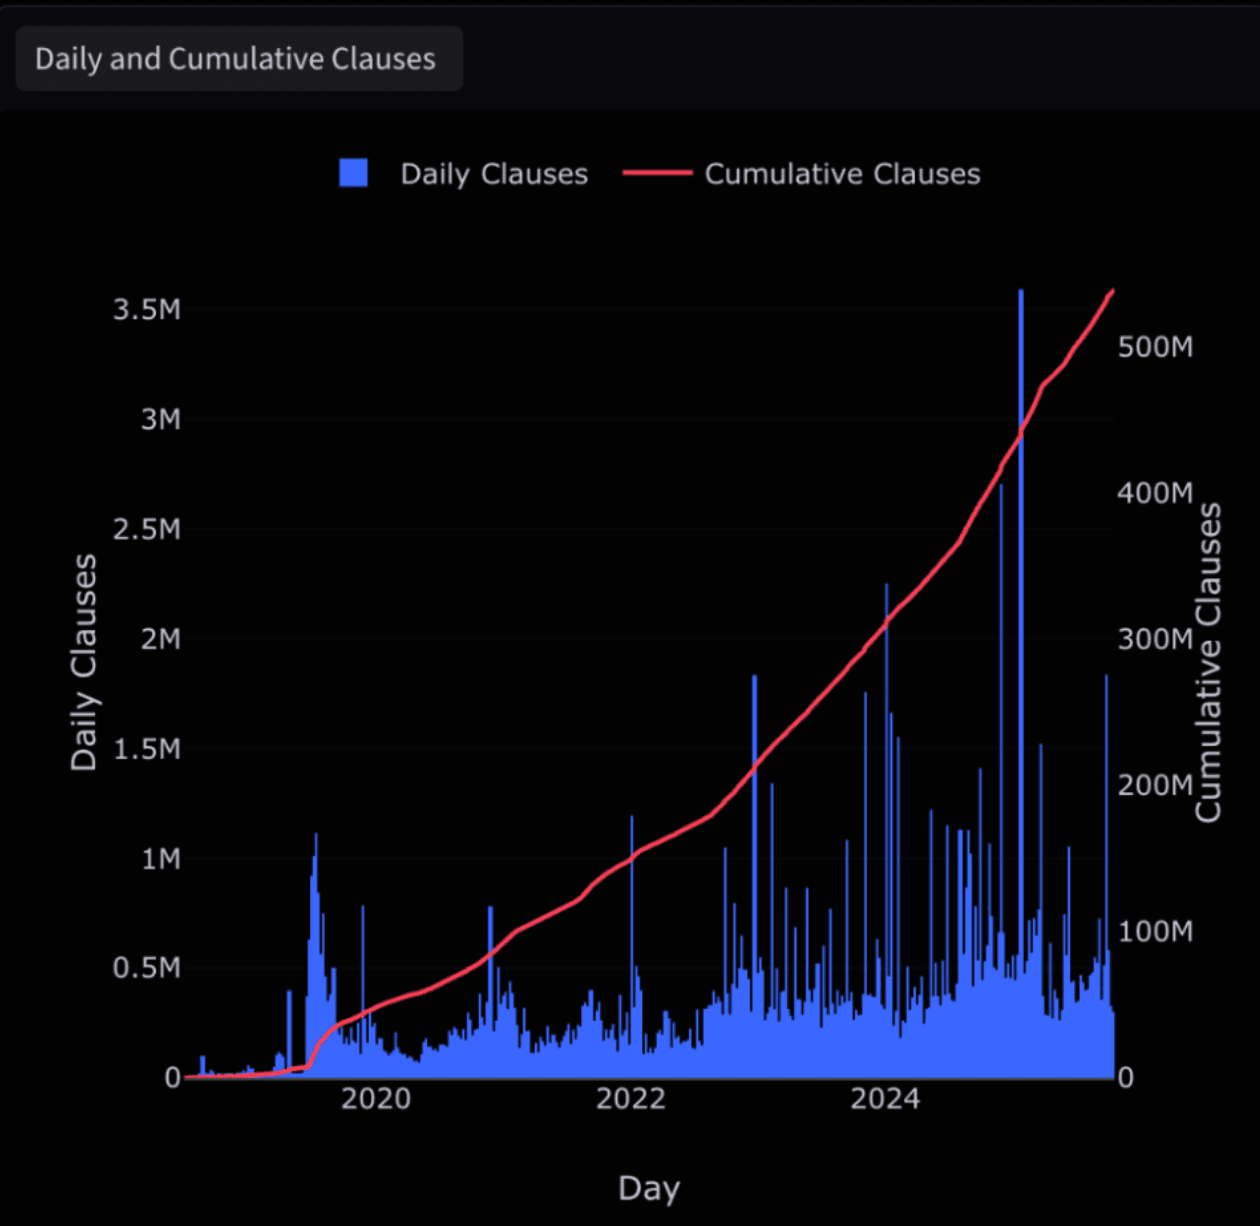
At the core of VeChain’s design are Clauses, which represent individual operations within a single transaction. Since each transaction can contain multiple Clauses, they’re a far better measure of actual network utility than simple transaction counts.
The chart below tracks both Daily and Cumulative Clauses, which have now exceeded 500 million, highlighting strong activity growth through 2024-2025.
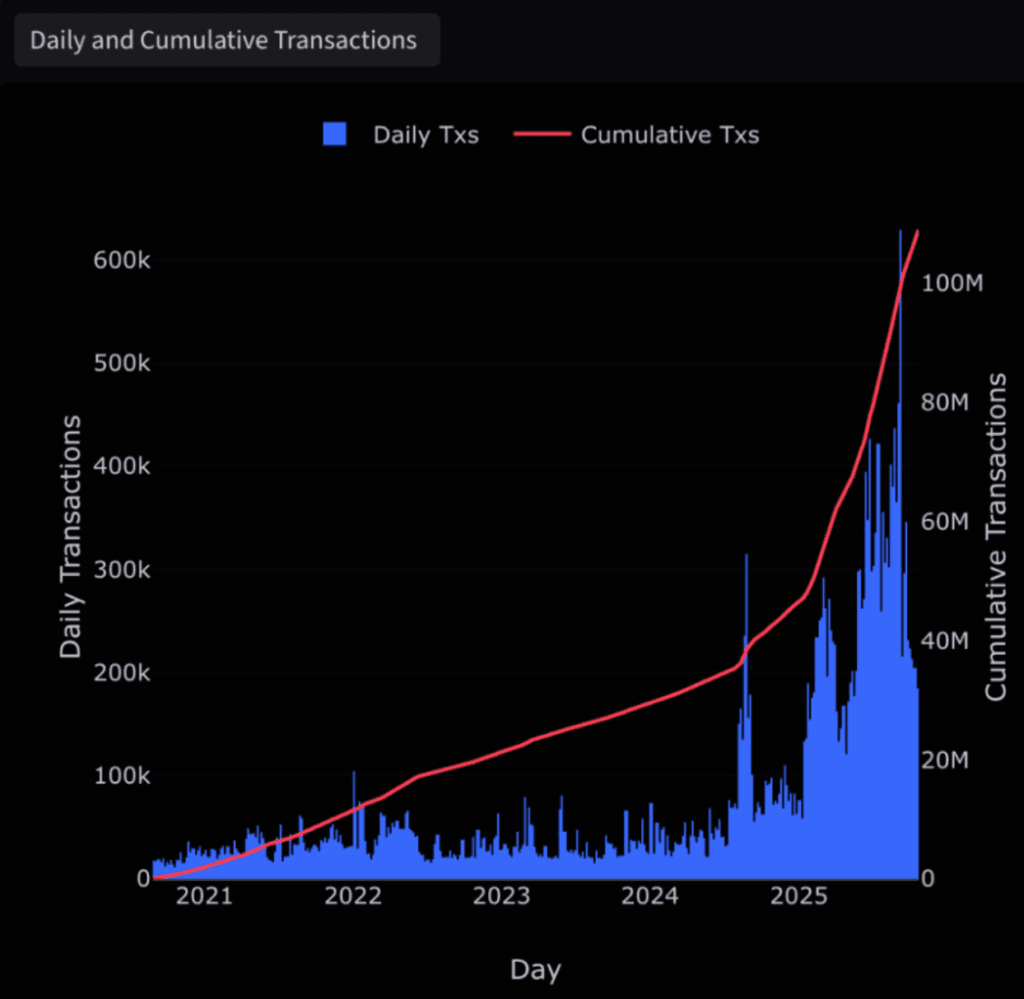
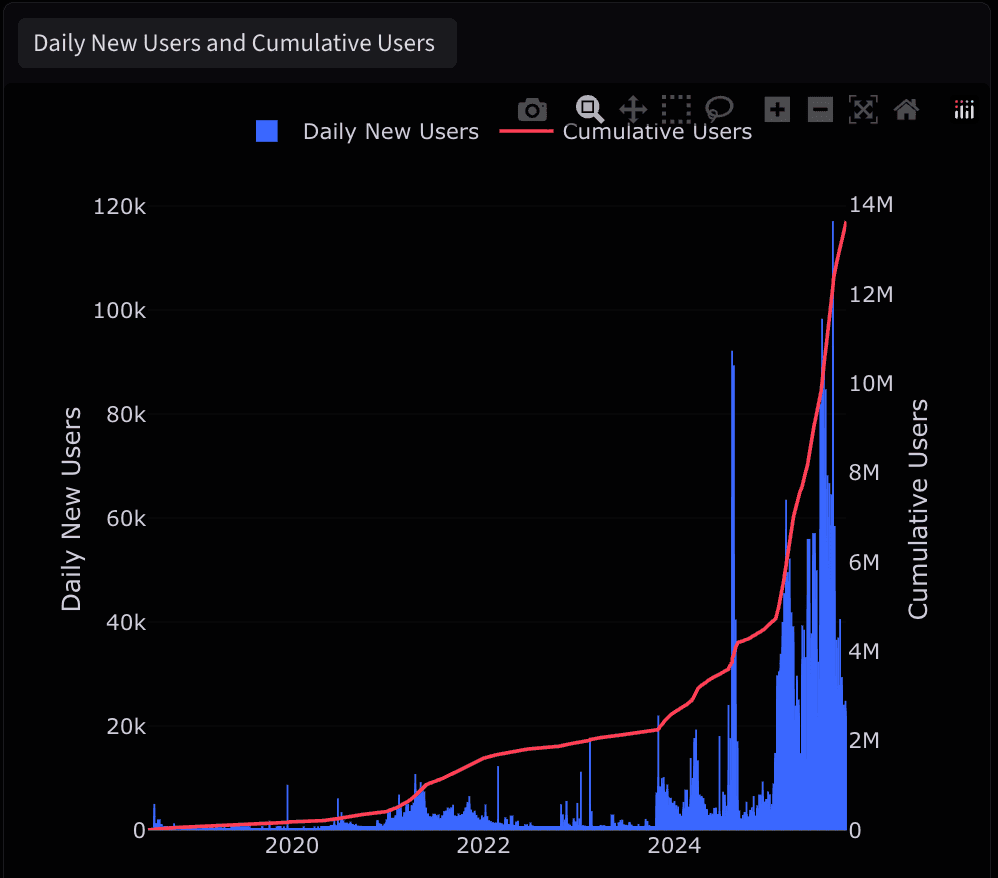
Alongside this, users can also monitor daily/cumulative transactions and daily new/cumulative users, painting a complete picture of usage trends over time.
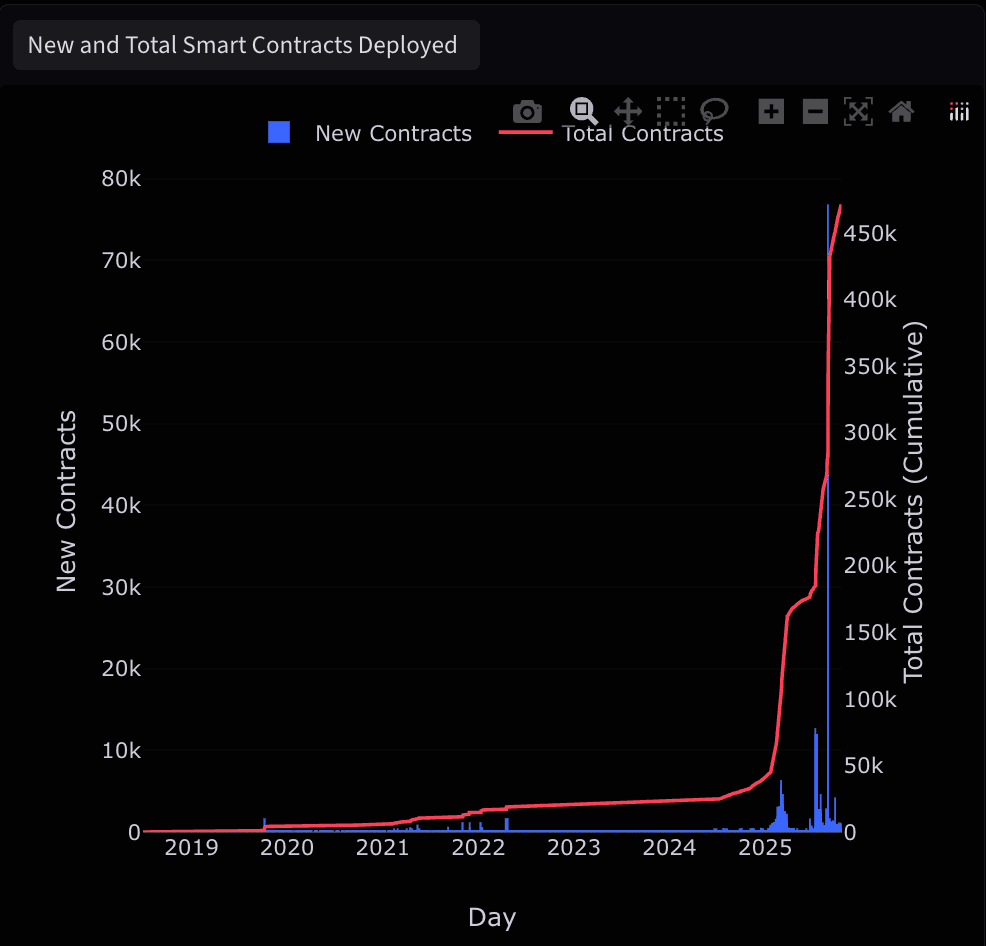
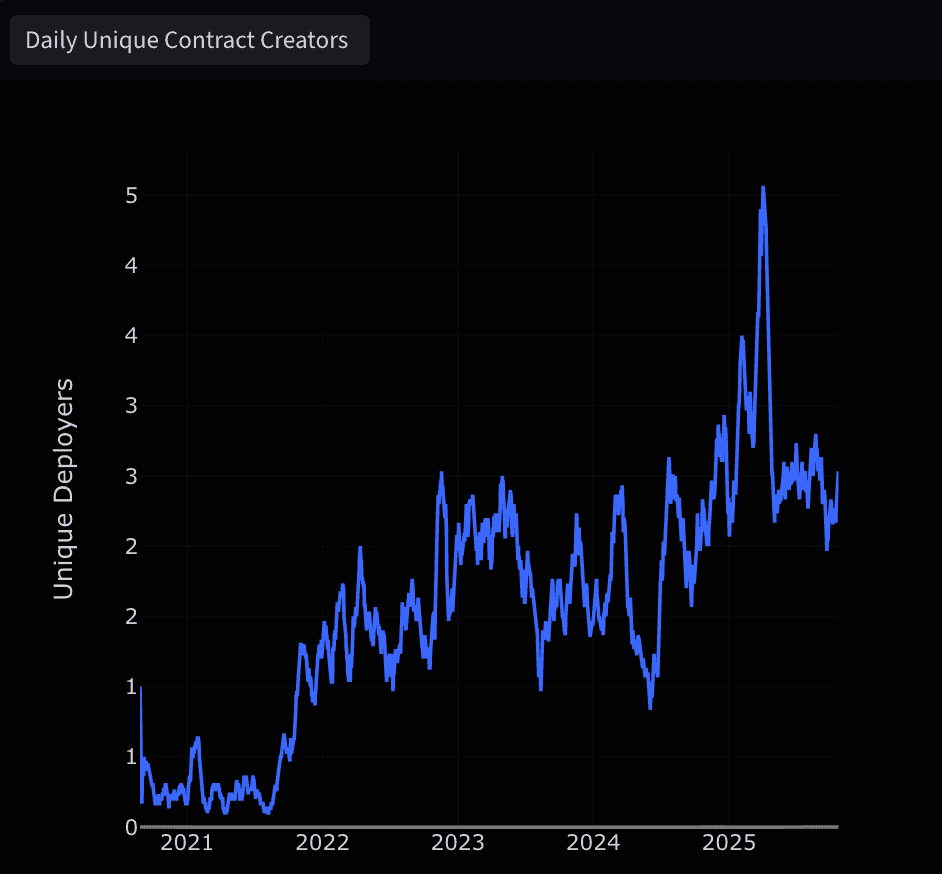
Also tracked are smart contract metrics such as total contracts deployed and the number of daily unique contract creators reflecting steady developer engagement.
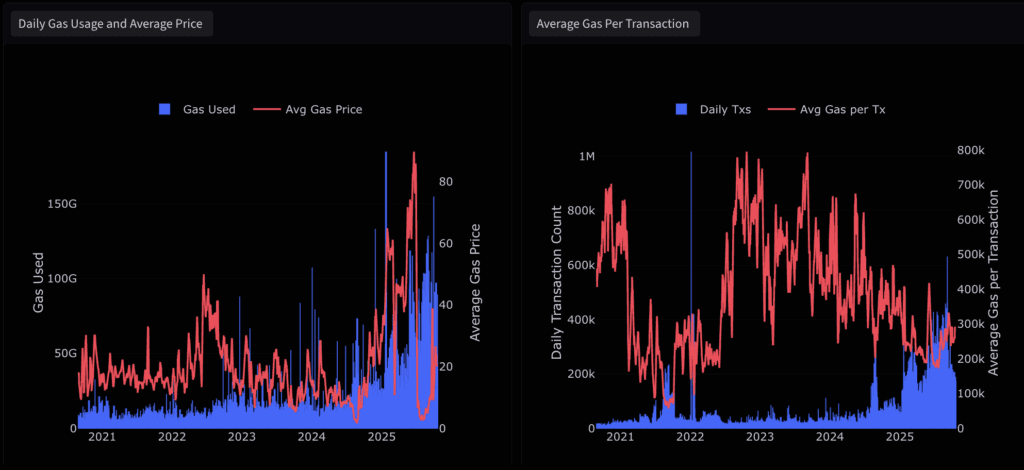
Additionally, gas metrics like total gas used and average gas per transaction help track network efficiency and cost trends.
Together, these components provide an objective, data-driven view of how active the VeChain network really is - across users, developers, and transaction layers.
2. VeBetter Ecosystem Spotlight
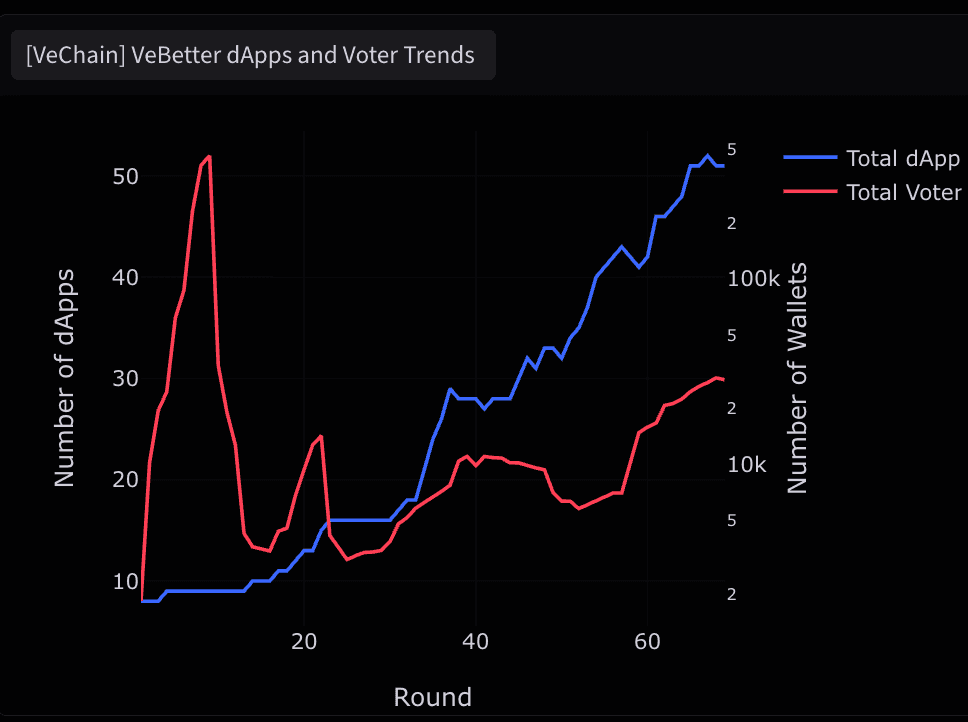
The VeBetter Ecosystem Spotlight section brings visibility into governance and community participation within the VeChain ecosystem, focusing on VeBetterDAO, VeChain’s onchain governance framework.
This section includes detailed analytics on total dApps, voter trends, and proposal activity over time, allowing users to study how community engagement and decision-making have evolved.
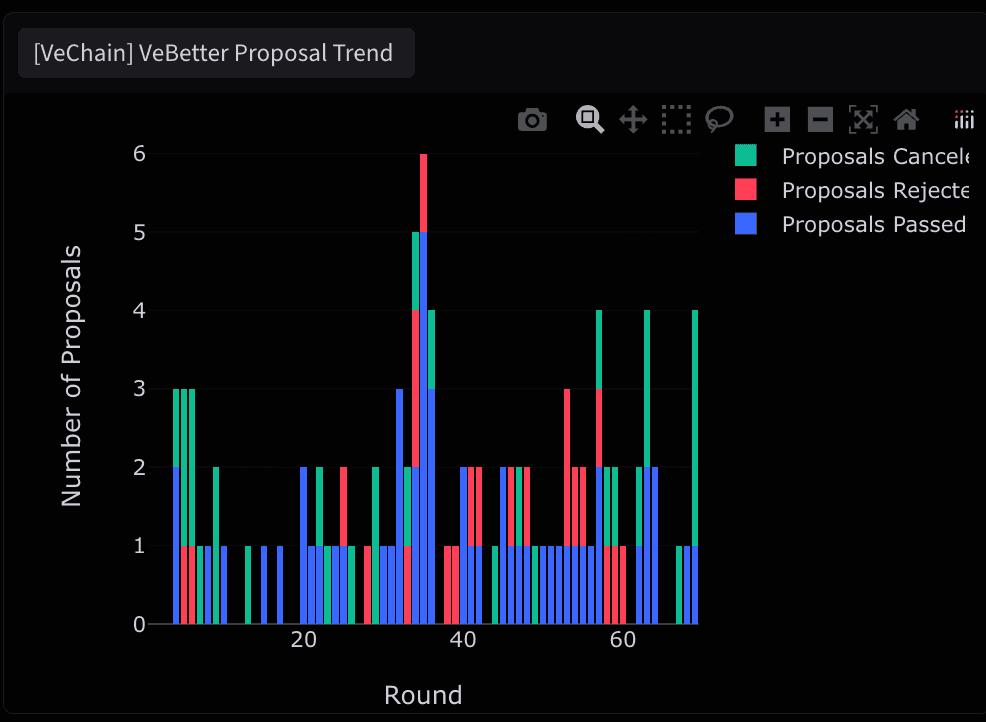
The Proposal Trend chart illustrates how many proposals are submitted, passed, or rejected per round.
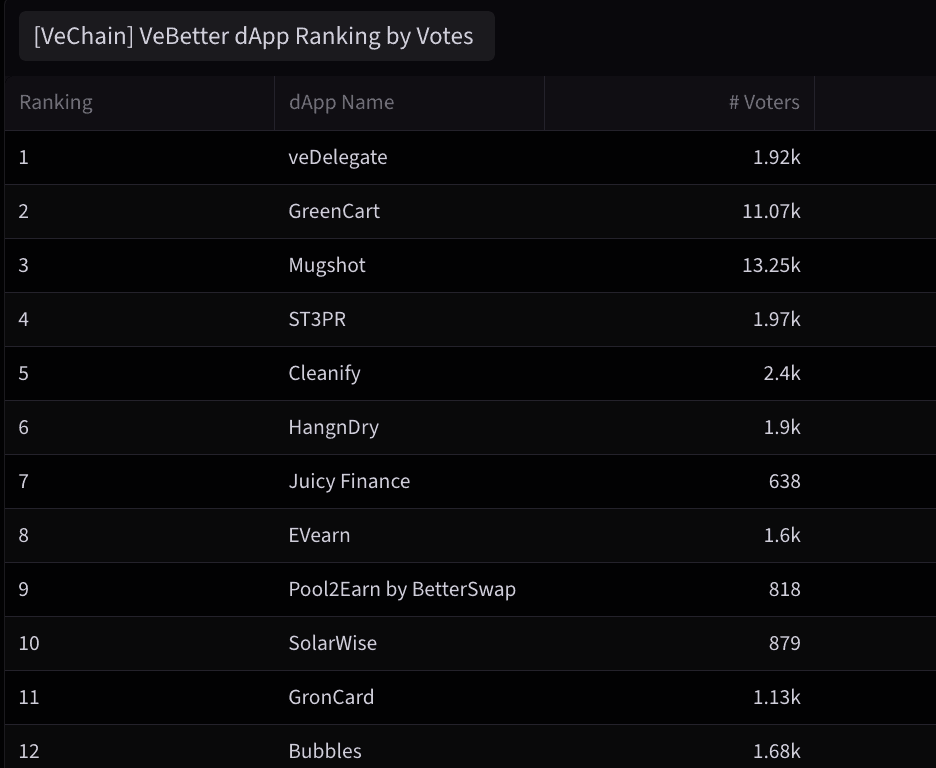
You can also look at how community preferences evolve across applications by looking at the
[VeBetter] dApp Ranking by Votes table.
These components bring transparency to VeBetterDAO’s operations and make it easier to understand how onchain governance contributes to VeChain’s network health over time.
3. Supply and Demand Dynamics
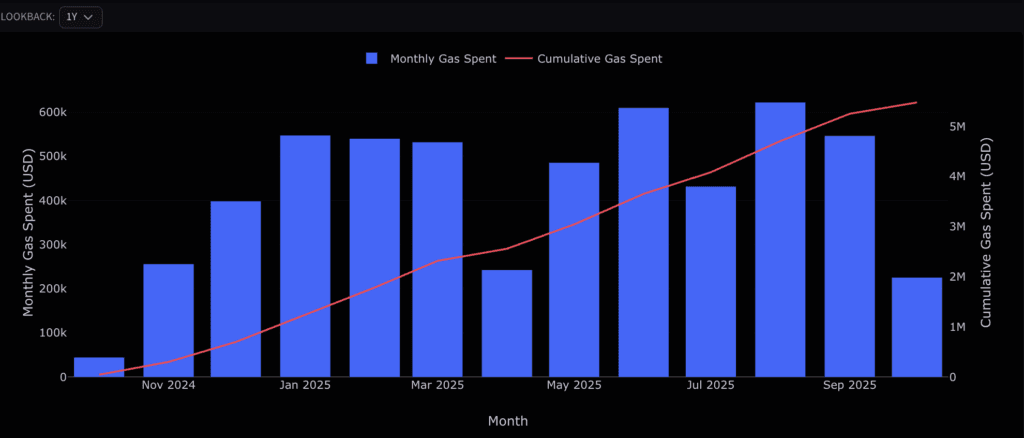
The Supply and Demand Dynamics section focuses on the economic layer that powers the VeChain network.
The chart below tracks Monthly and Cumulative Gas Spent.
The below chart shows VTHO burned, which can shed light on how network usage translates into token consumption.
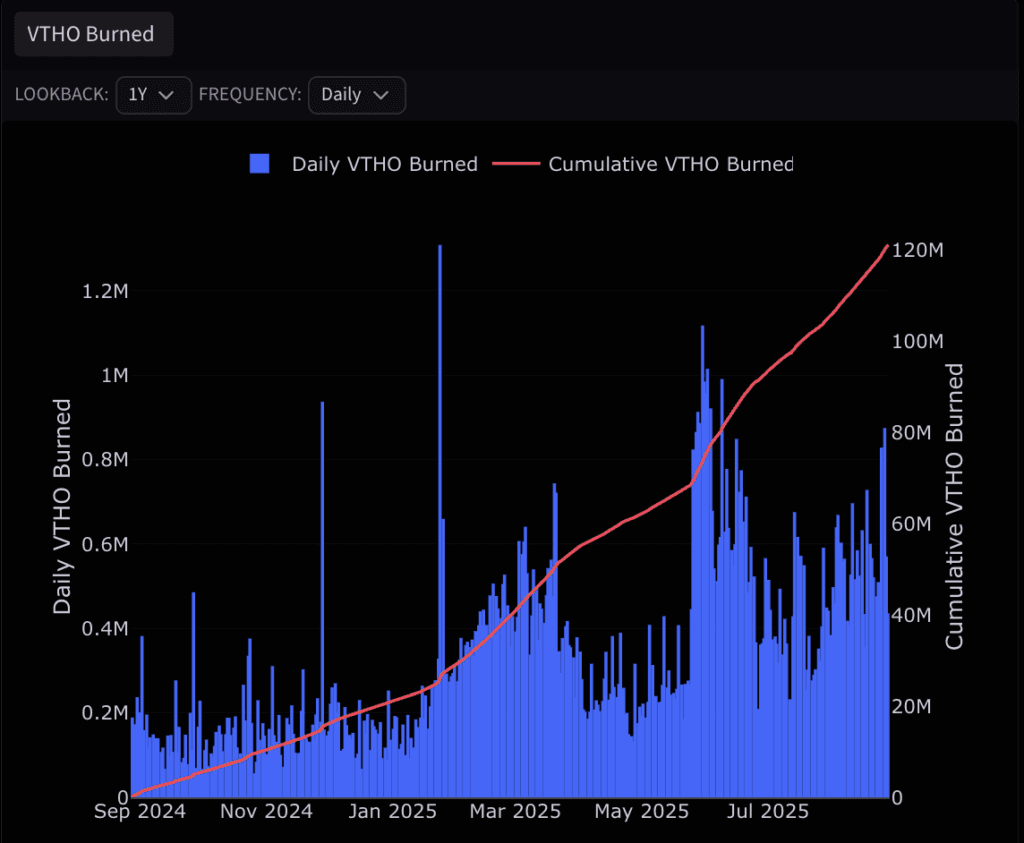
Together, these metrics reveal the relationship between activity and gas consumption, helping analysts evaluate the long-term economic sustainability of the VeChain network.
A Unified View of the VeChain Ecosystem
Across a wide range of components, the VeChain Network Overview Dashboard provides key insights into the network’s activity, governance, and token dynamics. Beyond the VeChain Dashboard, VeChain onchain data is integrated throughout The Tie Terminal. Users can explore VeChain assets in the Screener, visualize metrics in Charting, set real-time Alerts, and access the same datasets programmatically through the On-Chain API.
The Tie Terminal users will already see the VeChain Network Overview Dashboard under Presets in the Dashboard selection screen.
To learn more about The Tie Terminal and explore VeChain data in action, visit thetie.io/contact-us.
Stay up to date
Sign up to receive an email when we release a new post
