Tokens traded solely on decentralized exchanges are particularly susceptible to volatility in price and volume, as they often have little liquidity spread across vast ranges. By looking at on-chain liquidity pools, we’re able to identify and anticipate when tokens will have a higher volatility. Additionally, by looking at ERC20 tokens with the majority of trade volume done as an ETH pairing, we’re able to identify a price (in terms of an ETH ratio) that acts as a sell wall.
The Tie Research
Sell Walls & Liquidity Ranges: Trading on Implied Volatility
By TJ Keel
April 18, 2023
Liquidity positions for low volume, DEX-only tokens are often set in tight ranges where the majority of trade volume only slightly impacts price. On either side of these deep liquidity positions/walls, relatively low-volume purchases can easily impact price. That is to say, there are deep ranges with low volatility, and shallow ranges where price can swing wildly.
It is difficult to separate causes from effects in liquidity pool pricing. Are whale LPs dictating price by the ranges in which they LP? Are traders looking at pools as a guide for speculation?
To explore this dynamic, we’ll look at several ERC20 tokens where the majority of the DEX volume is paired against ETH. These case studies investigate how market makers are incentivized to structure pools based on target price, how avoiding impermanent loss affects range selection, and how this structure meaningfully influences the volatility of the token pairing’s price.
The rate at which a token’s price can accelerate is dependent upon its position within a given liquidity pool. Acceleration refers to the elasticity of pairings, and how heavily dependent they are upon the available liquidity at a given range. In other words, we’ll predict when a 1000Ξ trade will swing the market, and when it will hardly register.
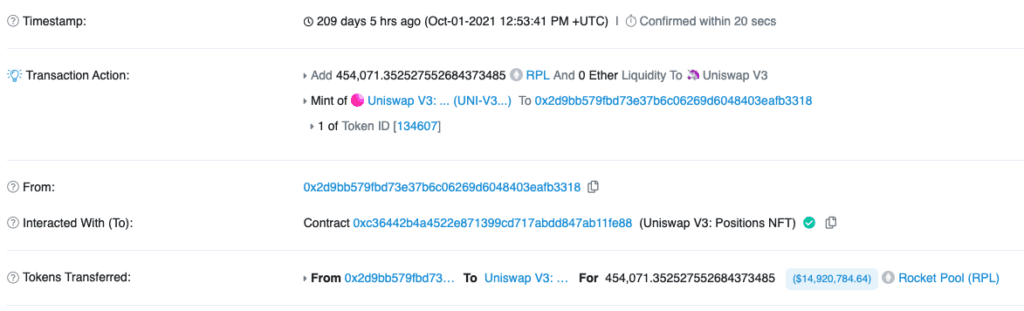
Case #1: RPL/ETH liquidity pools on Uniswap
A token’s price within any given liquidity pool exemplifies the intersection of locked supply for two demand-dictated pooled tokens. In this example, everything to the right of the pink line represents locked ETH within the pool, and everything to the left represents locked RPL. The pink line adjusts as ETH is exchanged for RPL (and vice versa).
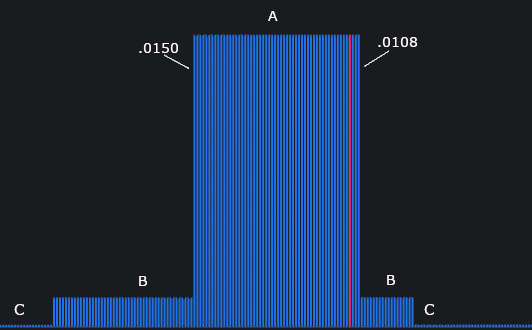
This LP chart can be divided into three sections showing where the majority of providers choose to range their RPL/ETH liquidity. The volatility of the RPL:ETH ratio increases from Range A, to B, to C as the trading depth decreases. Note the minimum and maximum price ratios for Range A; looking on-chain, we know Range A has been set by a single wallet.
From the pink line on the same chart, we see RPL currently trading within the majority of liquidity, and will move slowly in price until it exits Range A, or until this deeper liquidity position is removed or moved to a lower ratio. We see from the below chart the RPL:ETH price movement slows to a halt within Range A, often bouncing off it completely.
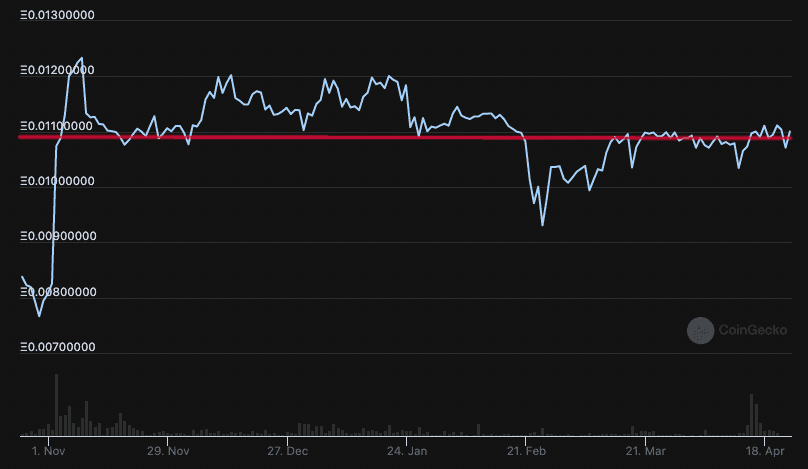
As a side note, I’d like to stress how this tendency for the RPL:ETH ratio to hug the red line is in no way related to technical analysis. As we’ve begun to show in this example, the RPL:ETH ratio is ‘trying’ to get into Range A by accelerating when outside it, and decelerating within. We’re not implying anything about market sentiment, animal spirits, or human psychology. No, we’re simply looking at a mathematical relationship.
In a market maker’s ideal scenario, all the trading volume happens within the range they have set, and that range is ideally narrow. In effect, the market maker is selling their token pairing at a price ratio they otherwise would have normally sold, with the additional benefit of earning LP fees.
The LP suffers when the price–in this case represented by the pink line–moves outside of liquidity in two different ways:
- The opportunity cost of the locked ETH.
- RPL being sold at a price lower than the LP’s valuation of RPL. To better understand how this tradeoff impacts implied volatility, we need to talk about impermanent loss.
Impermanent Loss
When a liquidity provider sets their position with a target sale price in mind (for either of the pairs), they calculate the geometric mean of their position rather than the arithmetic mean. This is done to insulate oneself from one token performing better than the other pairing to such a degree that they would’ve been better off not setting up the pool at all.
Below, Tetranode, an Ethereum Whale active in Defi. refers to the tradeoffs between setting up liquidity pools in tight vs wide ranges. Practically, the tradeoff ends up between fee generation and insurance against impermanent loss. One can hedge some risk by setting up deep, narrow liquidity in conjunction with shallow, wide ranges.
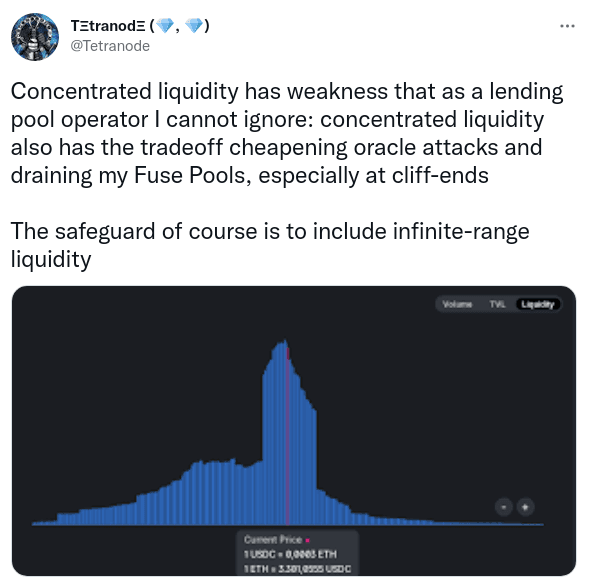
To be clear, this is a risk averse hedge. By combining a tight, fee-maximizing pool with a wide range of shallow liquidity, Tetranode hopes to insulate himself from too much impermanent loss, while retaining the upside of his concentrated range. Think of the wide, shallow liquidity as an attempt to slow down price movement outside the desired range. He’s willing to pay the opportunity cost of having ETH go unused on the periphery in order tosafeguard against runaway price movement.
However, Tetranode is deploying this strategy in a heavily traded ETH:USDC pairing. If you’re able to dominate the liquidity in a low-volume pairing, as we saw in the RPL:ETH example, where one of the pairs has a low market cap, you don’t need to bother with this hedge and can truly make the market as you see fit. That is, of course, until a bigger fish comes along.
Case #2: BAT/ETH liquidity pools on Uniswap
In this second example, let’s look at BAT, a popular token with trading volume on both DEXs and CEXs. Despite the vast majority of BAT volume occurring on CEXs, the BAT:ETH ratio is heavily influenced by a single liquidity pool on Uniswap; although not as strictly as a DEX only token would be. The majority of BAT volume on centralized exchanges are swaps for fiat or stables– this is important, as we’re not concerned with the USD value of these tokens, only their relative value to Ether.
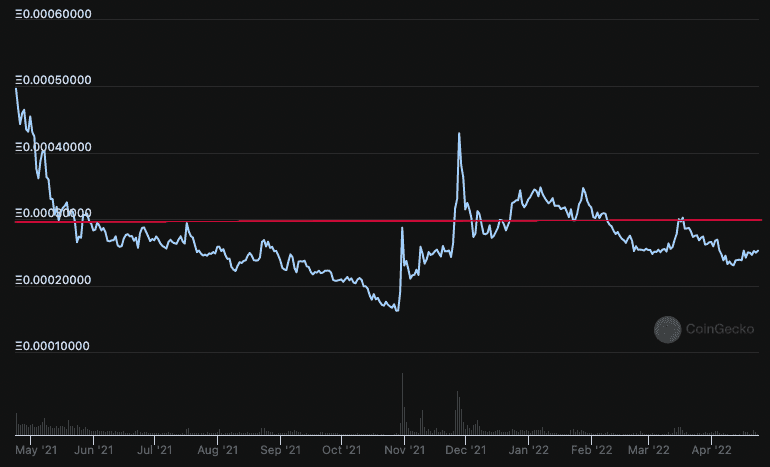
Looking at the next two charts, we can understand why the BAT:ETH ratio has tended to stay just below .0003Ξ despite turbulence in equity markets, real estate, and the cattle rights of the Fort Worth Stockyard.
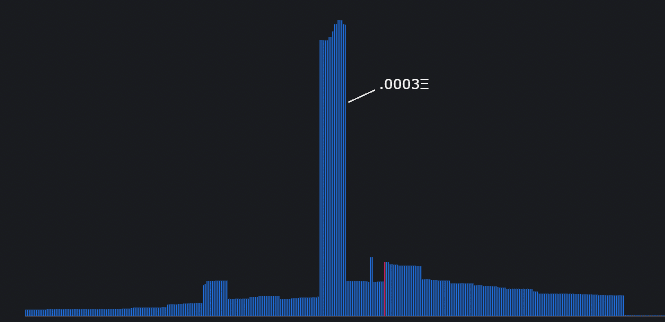
In the above chart we see the majority of liquidity being set in a tight, narrow range that acts as a sell wall. And in the chart below, we predictably see the price hit, and struggle to maintain movement beyond the deep liquidity position set up at .0003Ξ. We can even look at when this deep range was set up on-chain, and retrospectively see the relative price accelerate towards that position.
In the chart below, we see BAT begin to trend toward .0003Ξ around May 2021. Expectedly, the sell wall was set up in late April of the same year. This is further evidence for LPs being the cause, rather than the effect, for pricing in this trader/liquidity dynamic.
Perhaps the most important takeaway from BAT:ETH accelerating towards the deepest liquidity range is that this reliably happens despite the massive BAT volume on CEXs. In my opinion, and in this specific pool, the LP market thought it prudent to extend the liquidity far beyond this desired range due to BAT’s heavy CEX volume.
Should we expect BAT’s value in terms of ETH to be particular to BAT’s volume on Coinbase? That is to say, should we expect dollar value changes driven by CEX volume to alter sell walls, or other liquidity pool strategies?
The data we’ve looked at point towards no. It does not appear that esoteric markets within crypto are heavily influenced by outside activity. While it does appear that market makers do wield an enormous amount of price power within a given ecosystem.
Protocol Owned Liquidity and Final Thoughts
Various protocols have attempted to implement liquidity walls in order to bootstrap growth. By stabilizing the price, protocols hope to introduce confidence in their token as an asset; as collateral, or otherwise.
ICHI infamously cratered on April 11th 2022 when over-leveraged traders shattered a dynamic, protocol owned wall after a massive liquidation event. This moving wall was designed to give holders confidence via a much touted ‘floor’. Of course, after the wall collapsed, there wasn’t enough liquidity to hinder the instant 99% slide.
Olympus DAO, as another example, strategically owns the majority of their liquidity in an attempt to stabilize the price within sell and buy walls. By reducing volatility, Olympus believes they can build confidence in OHM as an asset. Perhaps entrenching a token with two walls will work better than ICHI’s single wall did.
From the cases we’ve looked at, the evidence suggests LPs are the primary actors in the pricing dynamic of DEX heavy token pairings, while traders are more reactive to liquidity and incentives. It does appear the market makers are, in fact, responsible for the market.
If a DEX only token has publicly available data pointing to an, albeit temporary, pseudo-pegged ETH ratio, would it even last? To my mind, it begs the question of information asymmetry, or if volatility is a hard metric to capitalize on regardless of accuracy.
It’s prudent for traders to consider the relationship between liquidity and token velocity. A reasonable strategy for a bull would be to front run low cap pairings that are in the process of deconstructing their primary sell wall. If the sell wall breaks, the front run LP will be immediately converted to the trader's desired half of the pairing at a better than market ratio. A bear, on the other hand, can avariciously short a protocol propped up by artificial walls, or cautiously steer away entirely.
To be clear, one cannot analyze liquidity positions in order to concretely anticipate price direction. However, one can anticipate volatility to a shockingly accurate degree that is not easily replicable within traditional finance. Acting upon the relationship between volatility and liquidity can amplify returns–both positively or negatively.
Regardless, the implied volatility based upon a token’s depth within a pool cannot be ignored by traders, LPs, or treasuries. Decentralized finance has the unique attribute of transparency, allowing everyday users to analyze positions and design strategy based on the activity of much larger players. Financial game theory fundamentally changes when one has access to real-time, trustless data.
The first two case studies looked at were not cherry-picked in any way. To see this pattern repeated, search a few pairings on Uniswap.YFI:ETH, LRC:ETH, and ELON:ETH to name a few.
This report is for informational purposes only and is not investment or trading advice. The views and opinions expressed in this report are exclusively those of the author, and do not necessarily reflect the views or positions of The TIE Inc. The Author may be holding the cryptocurrencies or using the strategies mentioned in this report. You are fully responsible for any decisions you make; the TIE Inc. is not liable for any loss or damage caused by reliance on information provided. For investment advice, please consult a registered investment advisor.
Stay up to date
Sign up to receive an email when we release a new post
BATcryptodefiimplied volatilityliquidity poolliquidity rangelpLRPOLProtocol owned liquidityRocket PoolRPLsell wallstradingweb3